A flourish to the end of week offset some of the damage done earlier during the week. What had the Stockcharter's to say about it?
Yong Pan of
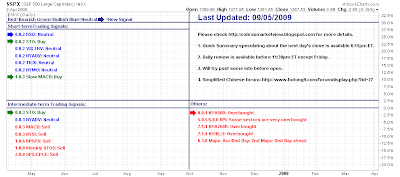
Cobrasmarketview has a neutral short term trading signal but a bearish intermediate environment - although Friday saw three new bull signals (2 on the short and 1 on the intermediate) and one neutral signal.
 Thursday and Friday lacked the volume punch to make them strong accumulation days

Tuesday may say more

Interesting upside targets for the rally; the Monday rally breakdown gap been one possibility

In contrast, Richard Lehman has drawn a possible bearish outcome - although the resistance channel lines are under threat of a breakout.

In his comments he stated:
9/3 -- A slight bounce finally emerged within the new purple short term downchannels. It would represent a shorting opportunity if it gets up to the upper purple lines, but that may or may not occur quite so perfectly. The main thing to remember is the downtrend itself. Gold seems to be the new bubble -- now that oil, financials and China are down, the speculation has to go somewhere.
9/2 -- Downward momentum continued on the equity indexes with the exception of the XTC and XAU. In the case of XAU, it resulted from the acceleration in gold itself. DXO took a bath after it was announced that it would close as a result of regulatory pressures by the CFTC against oil speculation. VIX futures moved up, establishing almost as much premium again as there was in the last few weeks (the drop in the market closed the premium in the futures as the spot VIX climbed). In other words, teh VIX people now expect more declines in teh next month.
9/1 -- The move that the VIX futures have been predicting for weeks is now upon us. In two days VIX has jumped more than 4 points. We have broken green short term upchannels that are now solid purple downtrends on the major and sector indexes. We may have hit the lower lines today suggesting a bit of a bounce tomorrow, but don't mistake that for an uptrend -- this is not done on the downside -- it is a more serious change in momentum and is right in line with the seasonal weakness of Sep/Oct.
The markets were constrained by the one year green up channels and are correcting. Several have broken blue mini channels on those long term charts now. I predict we will see a move akin to the June/July decline over the next month.

Joe Reed gives his summary on the week:

Solid triangle breakout in Gold/Silver Index although I hadn't realised how extended the CCI had become

The VIX looks like it wants to go somewhere (higher)? But if it returns to the complacency of the last cyclical bull market it could easily drop another 10 points (then things would really get interesting for bears).

Oil consolidating for a little longer before pushing higher?

Is Matthew Frailey of Breakpointtrades.com suggesting the start of a new cyclical bull market?

Excellent chart comparing Baltic Index to S&P - not good news for bulls.

The Frailey EWT take

Bull wedge breakout for VIX (bearish for S&P)?

Finally, Ahsan U. Haque of TheSmartTrader looks to be bearish too:

Dr. Declan Fallon, Senior Market Technician, Zignals.com the free stock alerts, stock charts, watchlist, multi-currency portfolio manager and strategy builder website. Forex data available too.


