With things winding down into the holidays it was a relatively quiet week for the markets. Overbought conditions were eased somewhat, but what had the Stockcharters to say about it all?
Maurice Walker opens with psycho bears:
In my opinion the bears have gone psycho, for ignoring the obvious technical improvements. Many investors in the stock market are just like those movie-goers who went to see Psycho in the early 1960s, they have no idea what will happen next and they don't know how the story ends until after its too late. For many investors the stock market can bring intense feelings of horror as they experience a living nightmare. In a few weeks their porfollios will blow up in their faces. Now those of us that use technical analysis, we may not know every twist and turn in the future of the stock market, but we can know the ending. Using technical analysis we can determine when the ending of a trend has transpired. Utilizing any number of the weapons in our technical arsenal, can allow us to position trade successfully by using intermediate trends.
Furthermore
But if the bears continue to willful ignore the bullish technical picture, the will go psycho.
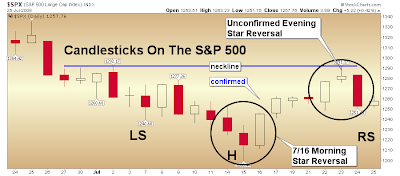
Now I continue to believe that the stock market is carving out some reversal inverse head and shoulders chart patterns of the complex class. These patterns can clearly be seen on the 60-minute charts. I believe that these patterns will allow a higher low to form which will carve out the right shoulders. The S&P 500 is now testing the 1250 level of support, should that be violated the next key level of support is at 1240.
The DJIA already broke the 11,400 support, but there left shoulders found support near the 11,200 area. The QQQQ continues to trade between the 43.50 to 46 range. The $46 dollar area is where overhead resistance is and it is also the neckline of the complex inverse h & S pattern on the 60-minute chart. The ADX line on the S&P 500 is declining and I expect to ultimately move below both DI lines. The directional movement indicator (DMI) should either get a bullish DI cross (+DI crossing above -DI) once prices rise to challenge the last minor high or we could see a period of crisscrossing.
There is still have a chance to test the July 15 lows and form a double bottom pattern as well. So keep your eyes open for any signs of a reversal candlestick. Whichever pattern forms, I don't think the selling is over yet, but I do think the bears will continue to attempt to drive prices lower, but this will only present another buying opportunity for the bulls. I expect the right shoulder to develop until next Thursday, when 2 Q GDP is released. The we will get the jobs report on Friday. The bears continue to disregard this rally, but the volume trends have been excellent and prove that this rally has legs.
This market has stood before a firing squad of bears (the executioners) that have tried to blast this market to death, but so far they have been unsuccessful in killing it because it has proven to be bullet proof. The transports failed to confirm the DJIA in bear market territory, the stock market is now out of bear market territory, and everyone who has predicted a recession has been proven wrong so far.
But will oil develop a more pronounced double top which would be bearish for equities (with respect to the rally back to $145-$150)?

Should a decline would shape a nice head-and-shoulder reversal for the indices?

Maurice's McClellan charts shows the market tops and bottoms nicely, but I would not overlook the divergence from November 2007-March 2008 when the McClellan Summation index rose from oversold levels as the markets made new lows; Maurice should have highlighted the November low over the March one - hindsight tunnel vision.

Eric Muathe has new promotional charts on his list; what are his 2008 picks?
Henry Ford is another stockpicker with a list (www.tradesniffer.com)
Richard Crockett holds top dog of the stock pick lists; but the style of his leading bullish percent chart looks oddly familiar ;)

Yong Pan sees an increase in bullish market sentiment but has doubts on the longevity of the current rally:

How will the Shooting Star/Evening Star play out - no confirmation from Friday?

But is there a 'buy' in play from new highs:new lows?

Joe sees no solace in Congress failing to develop a solution to the Oil-Energy crisis.
The Good news is Congress passed a Financial Package to stand behind and support the Mortgage Mess. Also supports Fannie Mae and Freddie Mac who back 50% of all mortgages in the USA.
The Bad news is Congress is taking a Multi-Week Vacation without finding a solution to the Oil-Energy Crises. A lot of people are Hot about that and think they should hold an emergency session instead of tanning their bods.
His Dow chart neatly shows resistance from early 2008:

He is still on bottom watch for Energiess:

Retailers still look to be in trouble:

Ted Burge has a nice clean (historical!) chart for the financials:

Finally, Richard Lehman had this to say of recent channel action:
7/26 -- Even the flatter uptrend scenario is now cracking as the major indexes roll over. In most cases there is a scenario that stills allows this to be a short term uptrend off the July 15th low, but one has to face the possibility that we have already peaked on this countertrend move. On the long term charts, this is beginning to look like the January low which bounced up only to roll over in February and then again in March.
7/24 -- As I said before, the steepness of the early move off the 7/15 lows would not sustain and that the channel would have to flatten. That first leg broke on the bell this morning and we got exactly what we should have expected-- only quicker! I drew the red mini downchannel mid-day on the Dow which made 11350 or so the near term target. We hit that right at the close!!! The XLF was a nbepon sign saying 'short me' at 23 yesterday, and you still had plenty of time to do it even today. The channels have given you loads of precision trades on this move so far -- both up and down.
So, while others may not see it this way, WE know that we're actually still in an uptrend that just widened and flattened. The SPX is the only index that appears to have broken lower support in this scenario. The Dow, Naz and XLK all stopped precisely on their lower support lines. As long as they don't break on tomorrow's open, we should bounce back upward.
7/23 -- The short term charts now show well defined upchannels off the lows on 7/15. Most have upside potential in them, though the Dow is sitting right on its lower line. GLD and XLE are in steep downtrends, which is no surprise as the hedgies unwind the short stock--long commodities play. Financials (XLF) are amazing. I guess the Barrons headline about banks being the bargain of a lifetime probably helped. But look where they have recovered to!! Right back to the upper line of the 40-day and one year downchannel lines. If you were waiting to get out of financials, this just might be a good time.
Dr. Declan Fallon, Senior Market Technician, Zignals.com the free stock alerts, market alerts and stock charts website


