Posts

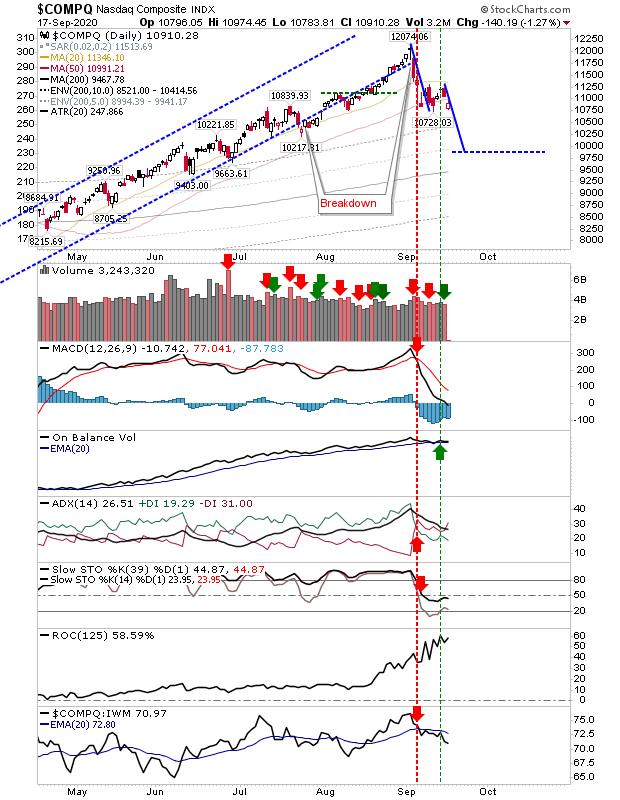
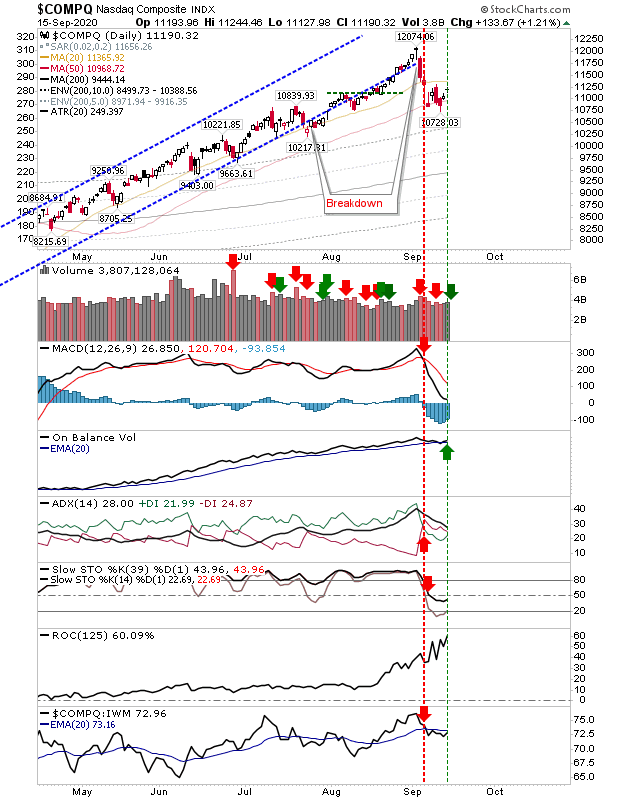
Measured Moves Down In Play for S&P and Nasdaq

Image
Friday's selling sees a break in the 50-day MA for the S&P, following the lead of the Nasdaq from last week. Selling volume climbed in confirmed distribution across the indices. The measured move targets for both these indices remain in play with each swing low likely to breached Monday. Not surprisingly, technicals for the S&P and Nasdaq are both net bearish.

S&P and Nasdaq Move Towards ABC Correction

Image
Indices gapped lower in what's evolving into an ABC style correction; in essence, a zig-zag move lower with a projected target of the measured move of the initial decline. For the S&P, today's selling also registered as distirbution. The Nasdaq has a measured move target of 10,000. Technicals are mostly negative with On-Balance-Volume clinging on to its 'buy' trigger. Today's selling also undercut the 50-day MA with a gap lower. Buyers are unlikely to step in now, so until the index reaches a level attractive to buyers (hence the likelihood of an ABC correction) I will be looking for lower prices.

Early Gains Fail To Follow Through

Image
A bright start with opening gap gains were unable to follow through.  The Nasdaq gain came off its 50-day MA with a higher volume (accumulation) bounce. The gains were enough to see a 'buy' trigger in On-Balance-Volume but other technicals remain negative. However, as long as he 50-day MA holds this should be viewed as a pullback in a bullish advance.

Indices Close Lower With Swing Lows Under Pressure

Image
The Nasdaq closed below its 50-day MA as the early week swing low finds itself vulnerable to an undercut and loss of support. Expectation would be for a measured move down, which given the 1,000+ point move from the 12,074 high to the swing low, would set a current target around 10,250. Technicals are net bearish with the index underperforming relative to the Russell 2000.

Archive

Show more