May as well try and get a review post up before Monday's open. Feeling very sleepy... 2 hrs sleep on a red-eye is not good for the soul.
Dr. Joe raises the issue of "Agflation". Interesting thought - but I think commodities have peaked for this stage of the bull cycle, although the best may yet be to come.
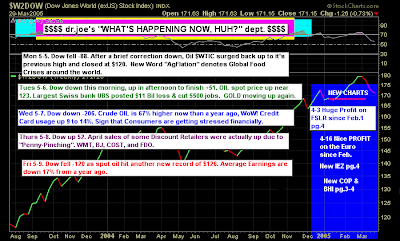
Joe is looking at a potential breakout for oil companies - but commodity-based stocks tend to lead commodity prices, so if they fail to break it would be bad news for oil:

Not marked, but there is a 'sell' trigger in the Dow's PPO:
 Maurice Walker
 has jumped up the league table - his weekly review is worth the price of entry. Maurice looking for a breather in the markets, his closing paragraph pretty much echoes what I think will play out. Follow his link to get his charts:
There was contest held a while back called the wacky warning label contest. Second prize in the competition went to a certain warning that was written on a kitchen knife that said 'never try and catch a falling knife.' Have you ever tried to catch a falling knife? It is very dangerous for obvious reasons. Sometimes as traders, we try and take positions when prices are falling, we refer to this as buying the dips. In the early stages of a trend this is a profitable strategy , but new money entering a long position at these levels does present a higher risk. The point is, that if we don't heed the message that the market is sending and chose to ignore obvious warning signs, we may end up with a nasty cut.
We've made a lot of money since the March lows and now is the time to pare down long position sizes and tighten stops, until a directional move has clearly been decided. A defensive posture is best, if wave A is concluding and wave B is forming. If strength is revealed here, then those of us who are swing trading, by playing the weakness on the intraday charts, will be forced to cover and take new long positions. I'm not saying that the advance has concluded, but since the breakout of the intermediate trendlines, we have run into a massive amount of resistance.
The stock market is in a bit of a quandary, being in a most awkward predicament after the breakout of the intermediate trendlines. The intraday charts have produced some very bearish signals, while the daily indices still have some technical support. The rising trendlines on the DJIA and the S&P 500 60-minute charts were tested and slightly violated on Friday. But the violation was not a decisive breach. Therefore, we find ourselves at a crucial level of support resting right on the 20-day EMA. If the S&P 500 breaks down further, it will not only break rising support, but it will also violate the recent minor low at 1383.
Prices have already broken below the intermediate downward trendline and horizontal support at 1396. If 1383 is violated, prices will run into more support at the 50-day EMA, and likely test the lower support of the recent handle formation near 1369. Should the 1369 support not hold up, then the last significant minor low at 1324 comes in play.
Last week the daily charts broke down as the MACD tipped lower producing a bearish cross, and the stochastic rolled over and is now hovering near the value of 50. If both indicators continue to breakdown, prices may resemble a falling knife. However, if buyers were to show some conviction at these levels, then the S&P 500 might get a third touch to its minor trendline, which would allow it to be reclassified as intermediate trendline. But with the S&P 500 having already tagged its 50 % fibonacci retracement from its October high, and the 200-day SMA looming above our current prices, the deck is stacked against the rally continuing. In addition to that, the S&P is running into overhead resistance from the December lows on its weekly chart.
During the course of the week, 10-minute traders of the SPY got some excellent signals that prices were breaking down. On Tuesday prices put in a second top at 142. The following day a head and shoulders top appeared, having broken down and backtested during the same session. Prices sifted lower breaking the double bottom confirmation line at 1397. That also allowed the rising wedge on the SPY 60-minute chart to breakdown. An attempted recovery occurred on the SPY 10-minute chart, as prices pulled back above the confirmation line, but resistance was found at the 50-period EMA. This marked another lower high that evolved into a descending triangle (1st chart down). On Friday prices gapped lower breaking the below the descending triangle, which has now become resistance. The SPY 10-minute chart continues to get lower highs and lower lows.
I've drawn some speculative Elliott wave counts on the SPY and QQQQ 60-minute charts, which shows that wave 5 was a truncated fifth (5th and 6 th chart below). Meaning that it failed to rise above wave 3 producing a double top formation. If my speculative count is correct, then we could be witness an abc move. The SPY already broke down from its descending triangle, but the Qs just formed one on the 60-minute chart. On a smaller scale of the Qs 10-minute chart you can even see that a small pennant has been carved out. Pennants usually are continuation patterns of the current trend, which happens to be down right now in that timeframe. These counts should not be treated as anything more than speculation on my part, because I have found that Elliott wave counts often need revision.
We have had a huge percentage run up since the March lows, and are over due for a corrective move. If the current rising trendlines break on the index daily charts, I believe that we will fall to test the 1324 minor low on the S&P 500. But I do think prices will stabilize near the 1340-45 area, which is the 50 % Fibonacci retracement off the March low (9th chart below). All I'm saying, is that if buyers don't step up to plate here soon, I would count on a short term corrective phase to transpire.
The VIX, which is the gage of fear, has a bullish falling wedge and apparently broke out on Friday (3rd chart below). I believe that prices will break down and cause the VIX to rise back up to its broke 2007 trendline in the form of a backest. If this occurs it will drive the market down. I remain long-term bullish but am short-term bearish (cautious). The inverse complex head and shoulders pattern on the S&P 500 has a minimum target of 1536. The same pattern on the Nasdaq has a target of 2683. Both price objectives would take us back to the December highs. thechartpatterntrader.com
Ted Burge's charts show tight resistance and support, nothing which makes decision making easy. Moving averages perhaps best guide.
His Qs point-n-figure chart is bearish:
 Yong Pan
 has the S&P at Fib resistance:

Weekly chart at bearish resistance:
 Richard Lehman
 on relief rally mode:
5/11 -- The major indexes for both large and small caps continued in downward minichannels Friday, but all held within their larger still-upward trending ST channels. The Dow and Naz actually touched support and held so far. Meanwhile VIX didn't even move, so the ST trend is still up -- at least for the moment. The longer term action is still heading higher in minis that actually broke LT declining trend lines, though they all have reversed since -- but that may just mean they are they are retesting the breakout. So despite fundamentals that will not get better for a while, the market is still in a 'relief rally'
5/9 -am- Dow and RUT have just about hit their lower green uptrend lines. Others still have some downside. Even the techs and other strong points are coming down to the lower part of uptrends. The big question will be if those green uptrend lines hold.
5/8 -- Its getting to be a bit of a mixed bag right now. The Dow and SPX lean toward being in ST downchannels, but the small caps aren't quite on the same page. Oil and gold continue up and VIX continues down.Best to see what happens in the next day or so.
5/7 -- Today's turn not only took away any new mini uptrend scenario for the short term, many indexes came down through the channels and broke them to the downside. The short term uptrends from mid-April are now suspect and perhaps even history. Long terms are all intact -- and isn't it interesting where the SPX came to and turned on the daily chart (my line at 1425 - not 1400 as everyone expected). This break will likely carry the short terms lower, though new channels or minis cannot be drawn yet.
Finally (and back to oil),
Jack Chan has the Energy Select Sector SPDR (XLE) in rally mode and has ignored the April MACD 'sell' trigger:


