Posts

Russell 2000 ($IWM) "ascending triangle" squeeze, with the Nasdaq and S&P struggling

Image
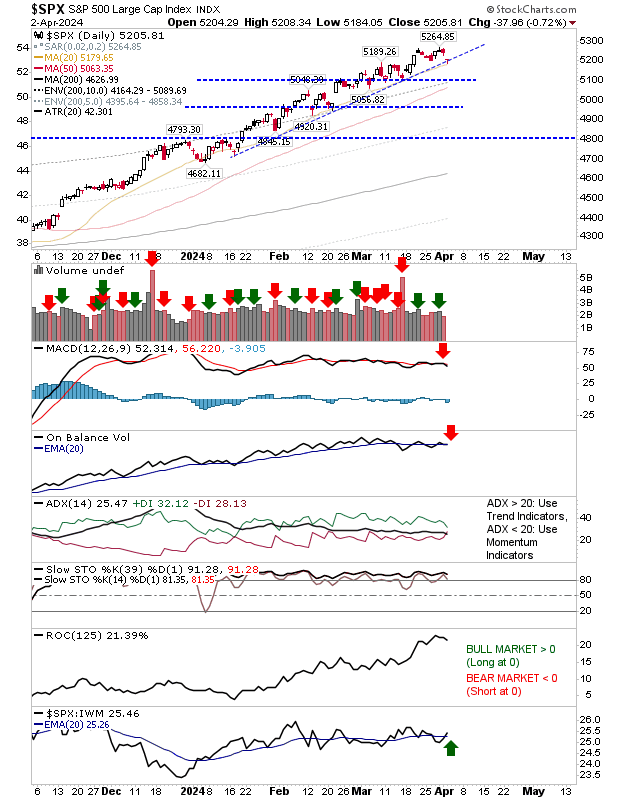
If there is a swing trade with plenty of tension ready to snap, it's in the Russell 2000 ($IWM). The index looks poised to either negate the late March 'bull trap', or crack below ascending triangle support with a big, red candlestick. Technicals still favor bulls, although the earlier MACD trigger 'sell' is a bit of a concern; note, MACD 'sell' triggers that occur above the MACD zero line are at best, weak 'sell' signals - often a good time to sell covered calls rather than offload a position. On-balance-volume continues to trend higher, and momentum as measured by stochastics is firmly above the 50 mid-level.. If there is a break of the trendline, then look for a move back to $187-189 in a likely continued evolution of a time-based, sideways consolidation. It's a bit of a different story for the Nasdaq as it returns to its breakout price on a move to challenge its 'bull trap'. This index has already broken trendline support, and

Russell 2000 ($IWM) finds support at rising trendline

Image
There wasn't much volume to Friday's trading, but there was enough to see buyers come in a trendline support in the Russell 2000 ($IWM). There was no technical change to the index with only a whipsaw signal in relative performance against the Nasdaq, although the MACD remains on a prior 'sell' signal.

Big bearish engulfing patterns as positive start negated

Image
It was a setting up to be a low key day, but come the afternoon, sellers pounced and drove markets down hard after doubts raised on future rate cuts. Fed news wasn't the key takeaway, but the loss of support was. The S&P was hardest hit, not because of the percentage loss, but because of the volatility relative to recent trading action. Today marked a clear breakdown of trendline support. It should be noted, the presence of the 50-day MA offers a point of defence but today's loss does not mean we will see a crash; a time-led consolidation seems more likely. Technically, the MACD accelerated its losses and there was a fresh 'sell' in On-Balance-Volume.

'Bull Trap' for Indices, but we have seen this before

Image
Not for the first time, we have markets edge a breakout before dipping below breakout support. While indices experienced heavier than typical selling on higher volume distribution, for the Russell 2000 ($IWM) this amounted to a retest of cup-and-handle support, and a trend test for the Nasdaq and S&P. If there was a risk of something worse, it was the potential breakdown in the Nasdaq rising trend. This breakdown will be confirmed if the index fails to recover by the close of business tomorrow. The S&P finished right on trendline support, and for day traders is the best call for a long opportunity tomorrow. The rising trend remains our friend until proven otherwise. While today's losses look damaging on paper, the opportunity on offer is one for buyers. --- Follow Me on Twitter Investments are held in a pension fund on a buy-and-hold strategy.

Archive

Show more