Posts

'Bull Trap' for Indices, but we have seen this before

Image
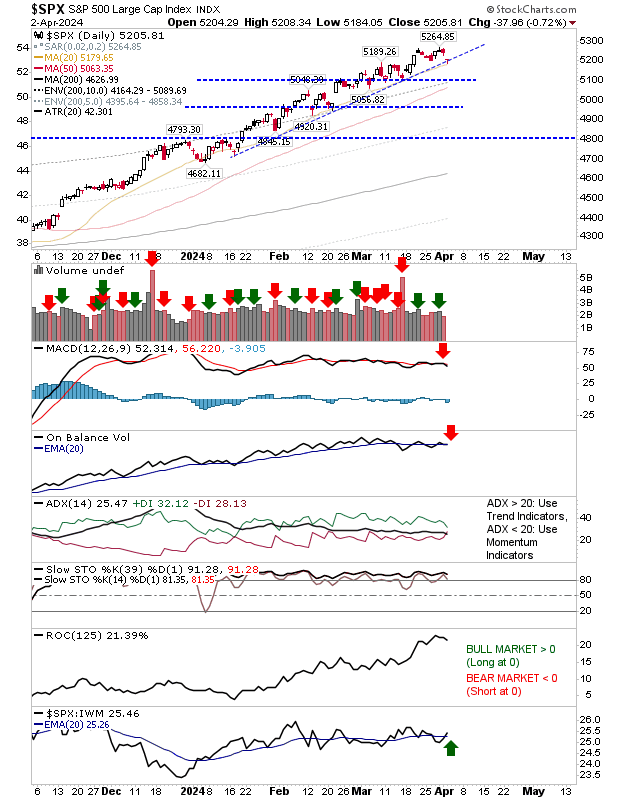
Not for the first time, we have markets edge a breakout before dipping below breakout support. While indices experienced heavier than typical selling on higher volume distribution, for the Russell 2000 ($IWM) this amounted to a retest of cup-and-handle support, and a trend test for the Nasdaq and S&P. If there was a risk of something worse, it was the potential breakdown in the Nasdaq rising trend. This breakdown will be confirmed if the index fails to recover by the close of business tomorrow. The S&P finished right on trendline support, and for day traders is the best call for a long opportunity tomorrow. The rising trend remains our friend until proven otherwise. While today's losses look damaging on paper, the opportunity on offer is one for buyers. --- Follow Me on Twitter Investments are held in a pension fund on a buy-and-hold strategy.

Russell 2000 reverses off resistance

Image
The Russell 2000 ($IWM) has shaped a four month cup-and-handle pattern, but Friday's challenge of handle resistance was not enough to generate the follow through needed to continue the rally. Despite the losses, On-Balance-Volume remains on a 'buy' trigger and the MACD has the potential to offer a 'buy' trigger of its own on the next gain. However, losses did reverse relative performance away from Small Caps to the Nasdaq. The Nasdaq banked a small gain Friday on trading volume which was lighter than normal. While price action gathered little attention, there was a return to net bullish technicals with a new MACD trigger 'buy' to go alongside the earlier 'buy' signal in On-Balance-Volume. Thursday's bearish black candlestick was not good to see, but Friday didn't deliver the losses such a candlestick can deliver. I have added a support trendline that will offer itself as an additional buy zone. Momentum is strongly bullish.

Round 2 for the bearish "black" candlestick in S&P and Nasdaq

Image
The Nasdaq started brightly but ended up closing below its open price, but above yesterday's close. The S&P did something similar, although the intraday range is narrower. These two setups are somewhat complicated by the new 'buy' triggers in On-Balance-Volume for both the Nasdaq and S&P. And the new MACD trigger 'buy' for the S&P. Price action is key, so I would expect the candlestick to trump the technical picture; watch for lower prices tomorrow.

Bearish engulfing pattern eats into Friday's Russell 2000 ($IWM) buying

Image
The Russell 2000 ($IWM) has been defending its 50-day MA over the early part of 2024, but the last few days have seen a shift in this support with 'sell' triggers in the MACD and On-Balance-Volume. The index is underperforming relative to the Nasdaq, but it has been a bit of a whipsaw scenario since early February. Buyers need to dig in soon because a loss of next support at the 50-day MA spells trouble and opens up for a test of the 200-day MA.

Higher volume buying doesn't negate Russell 2000 'bull trap'

Image
Options expiraton will have clouded Friday's volume, but Friday's buying in the Russell 2000 ($IWM) did not do enough to challenge the "bull trap" or the loss of the 20-day MA. The index is having to deal with 'sell' triggers in the MACD, On-Balance-Volume and relative performance against the Nasdaq. The expected result of the 'bull trap' is a move back to - then below - support defining the trading range off which the original breakout emerged. For the the Russell 2000 ($IWM), this means a move back to $188s.

Modest losses keeps indices near highs

Image
The earlier 'bull trap' risks look safely put to bed as today's losses just dipped into yesterday's gains. The S&P moved into a period of outperformance relative to the Russell 2000 ($IWM), although it came with higher volume (distribution) selling. The MACD is still on a 'sell' trigger, although it has flat-lined for most of 2024.

Minor losses don't deliver the reversal off bearish engulfing patterns

Image
Markets were set up for a sizable down day, or at least one to undercut breakout support, but this didn't happen. While there was no real change on the day the fact that there was no major losses should be viewed as a positive. The Russell 2000 ($IWM) finish right on $205 support with no technical change. The index is still outperforming the Nasdaq and the S&P. I'm watching for an intraday spike down to the 20-day MA, but would expect a close above $205 to maintain the story for a successful breakout.

Archive

Show more