Posts

Weekly charts offer optimism, but there was a weak finish for indices on Friday

Image
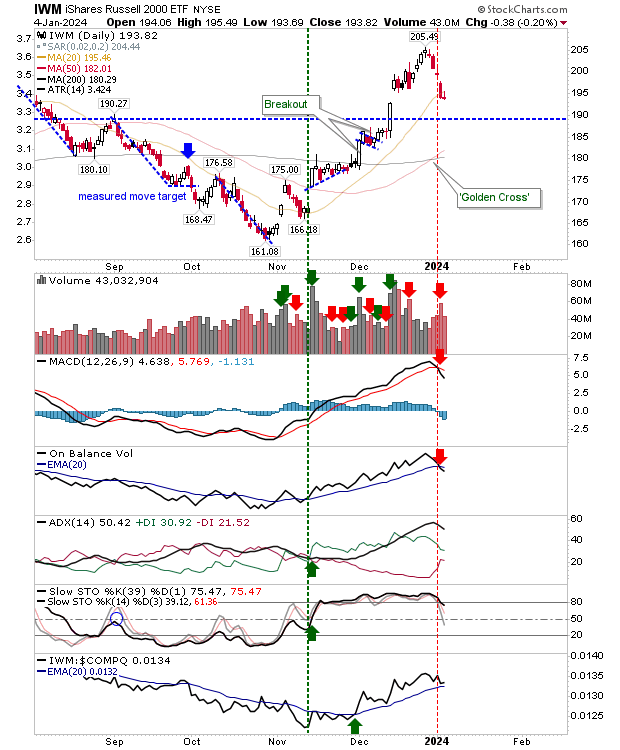
The good work of bulls was done early in the week but rallies had run out of steam by Friday's close, although the weekly charts still look good. On weekly timeframes there was registered accumulation for the S&P and Nasdaq but not for the Russell 2000 ($IWM). The Russell 2000 ($IWM) did close with a doji on the weekly timeframe and in a position to suggest a bullish (reversal) harami cross while also resting near support of $195.

S&P approaches highs as Russell 2000 treads water

Image
A bit of a mixed bag for indices. Large caps had the best of the action as the S&P and Dow Jones Industrial approached all-time highs. Buying volume for Large Caps indices didn't count as accumulation, but these indices are outperforming its peers.

Solid buying kicks off the development of indices swing lows.

Image
It was a good start to the week across all indices as buyers began the day in buoyant mood and didn't let up all day. If there is a caveat to the buying it was that there was little in the way of a pause or a test of buyer resolve over the course of the day. Volume was down for the Russell 2000 ($IWM), although the Nasdaq ($COMPQ) and S&P ($SPX) registered as accumulation days. The S&P ($SPX) recovered its 20-day MA with technicals unchanged, but improving.

Lows hold as a swing low takes shape

Image
Markets managed to hold on to early lows without the selling pressure of earlier in the week. While the buying was relatviely modest, it still wasn't enough to see a return above 20-day MAs for indices, although there is a good chance for a second bite of the cherry this week. For the Russell 2000 ($IWM) there was an "inverse hammer" at oversold near term stochastics, but not at mid-level intermediate stochastics - a level often associated with support during bull markets. There are 'sell' signals in the MACD and On-Balance-Volume to overcome but other technical supports are healthy.

Tests of 20-day MAs for Russell 2000 ($IWM) and S&P ($SPX)

Image
The Russell 2000 ($IWM) and S&P ($SPX) both finished near their respective 20-day MAs registered as test "fails", but not enough to suggest a recovery isn't possible tomorrow. The Russell 2000 does have the August swing high to lean on should it need it. Also, the closure of the December gap can be one to spark a recovery.

Markets start 2024 near (all-time) highs

Image
With the exception of the Russell 2000 ($IWM) we have the S&P, Dow Jones Industrial and the Nasdaq all up near all-time highs. There is the potential for some indices to return double tops, particularly if you look at Monthly charts like the S&P.

Being "Right" but still losing...

Image
I'm trying the Topstep Trader Combine as a sampler to day trading and it's an interesting setup with minimal outlay costs to get started. I'm not a huge fan of their platform UI but everything else has been pretty good so far. Today was one of those days where I waiting (and waiting) for the profit taking to kick in, but by the time sellers made their appearance I had reached my loss limit for the day and so that, was that. You can see all of my whipsaw trades here. For the record, I only work off price action, looking at support/resistance and tells like rapid stop take outs, usually a good sign for a reversal.

Archive

Show more