Posts

Semiconductor channel breakout

Image
A solid day for indices delivered a good week for Semiconductors. After a four month decline there was a clear breakout that took out the October swing high. Strength in the Semiconductors has, and will likely continue to feed into the Nasdaq and S&P.

The week starts with selling, but it's not too damaging

Image
After last week's buying it was expected sellers were going to make a return given the prior trend. However, the level of selling has been relatively modest and with three days of selling banked, the chance bulls will make a reappearance is high. The Russell 2000 ($IWM) has been the weakest index to date and had sold off the hardest so far. But the selling of the last three days has only managed to close Friday's gap higher. Today's volume was the first to register as distribution, but Monday and Tuesday's selling volume was light. The key concern is the rebuff off the intermediate stochastic mid-line; last week's rally wasn't able to push the indicator to the bullish side of this line despite the technical improvement in ADX, On-Balance-Volume and MACD. The Nasdaq tagged October swing high resistance on falling volume, but supporting technicals are net bullish with excellent buying momentum. Today's doji at resistance is a bearish marker, but

Sellers come in after last week's gains

Image
No surprise to see sellers come in after last week's solid gains. The good news is that selling volume was well down on last week's buying, and price action was relatively stable in the Nasdaq and S&P. The Russell 2000 ($IWM) was rebuffed by its 50-day MA, but it's going to take a few days of selling before this could be viewed as a concern. The worry for bulls is that all of last week's buying was unable to push intermediate stochastics above the bullish midline, and today's selling registered as relative loss against the S&P.

Strong recovery, but not all indices out of the woods yet

Image
On daily time frames markets had an excellent week, but the large white candlestick on the weekly time frame after weeks of bearish red ones is not typically bullish or one that typically marks a bottom. Having said that, there is room for bulls to work with, and even if markets shift sideways from here I would still look at this as a positive. The index I'm most concerned with is the Russell 2000 ($IWM). Last week, I noted the June low support test, and was of the opinion that it wouldn't hold. Well, buyers didn't listen and instead what emerged was a picture-perfect support test. With that done, we are now looking at a probable test of the 200-day MA; to add to this, the 200-day MA will soon be subject to a bearish "Death Cross" relative to the 50-day MA - a long term bearish factor. These are weekly time frame tests and whether upcoming tests are successful or not will be determined on this time frame.

Weekly trend break for S&P

Image
Daily charts show indices in a bit of a freefall, so focus shifts to weekly timeframes. The S&P was the last of the lead indices to break weekly-trend support, lining up the 200-day MA for the next support test. Volume climbed to register as distribution, rubbing salt into the wound of bulls. The only positive for bulls is that intermediate stochasics [39,1] are above the bullish mid-line, but with other technicals turning negative it's unlikely to stop the rot.

S&P and Nasdaq play catchup with Russell 2000 weakness

Image
For a change it wasn't the Russell 2000 taking the bear market highlight report, but the S&P and Nasdaq instead. It was always going to be hard for indices trading near prior swing lows to hang on to those lows with the peer Russell 2000 ($IWM) was in freefall. Today saw a decisive break of the 20-day MA for the Nasdaq, with only the (generally) light volume acting as some succor, while the S&P registered a firm distribution day. Starting with the Nasdaq, the measured move target that had offered some support alongside the 200-day MA is no more. We can now start tracking the percentage loss relative to this moving average before we get to a major swing low, although a loss greater than 10% against its 200-day MA is needed before we get to a period of historic weakness greater than 90% of past price action dating back to 1971.

Indecisive bounce for indices

Image
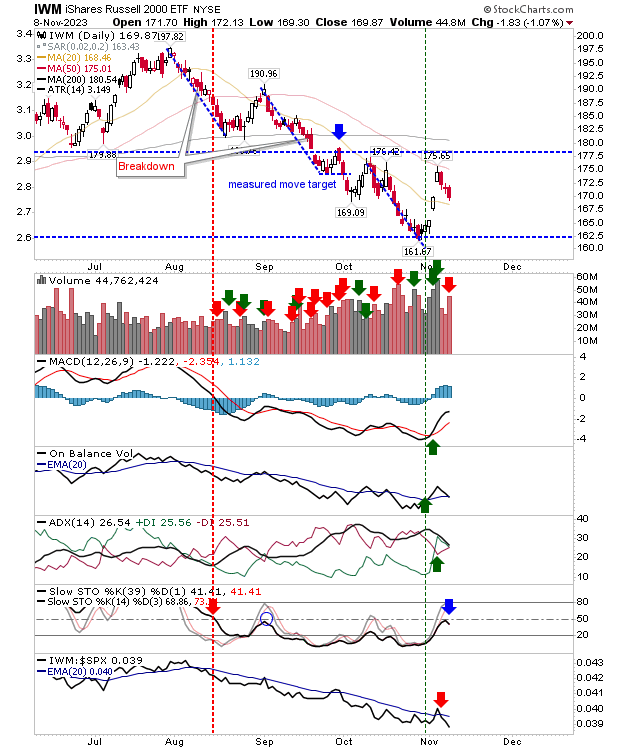
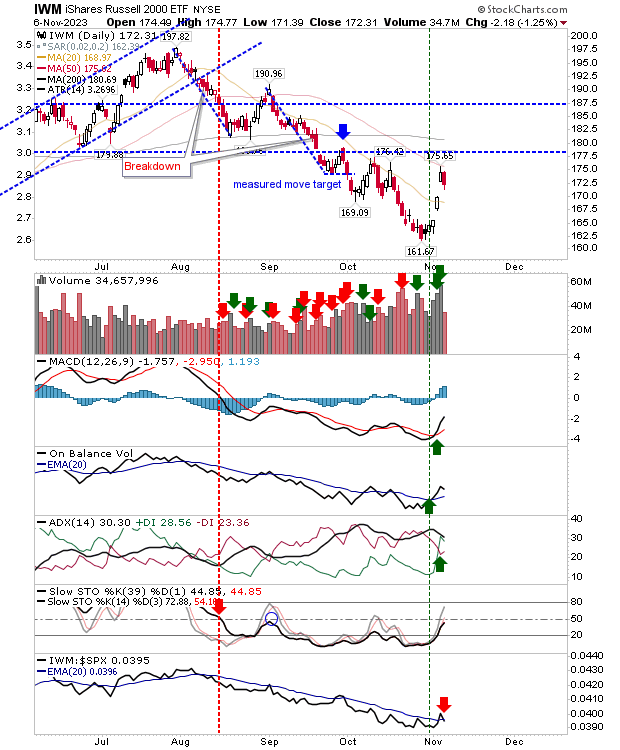
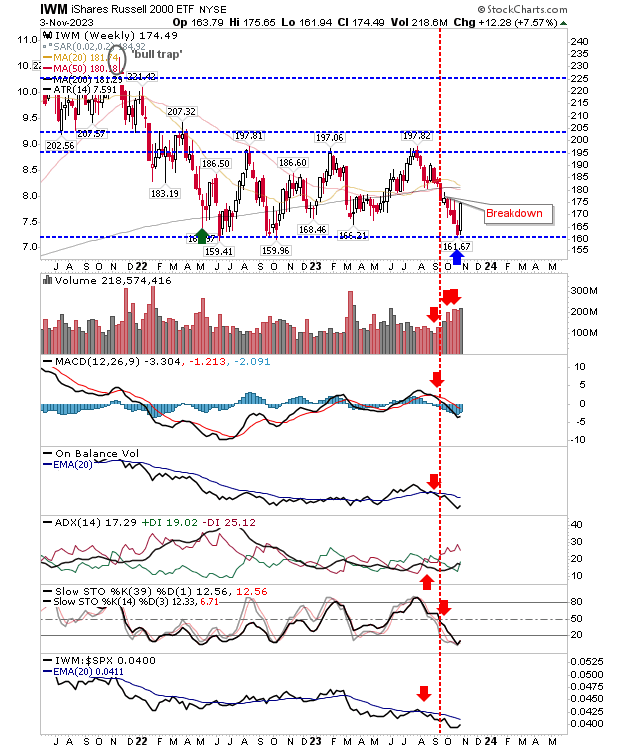
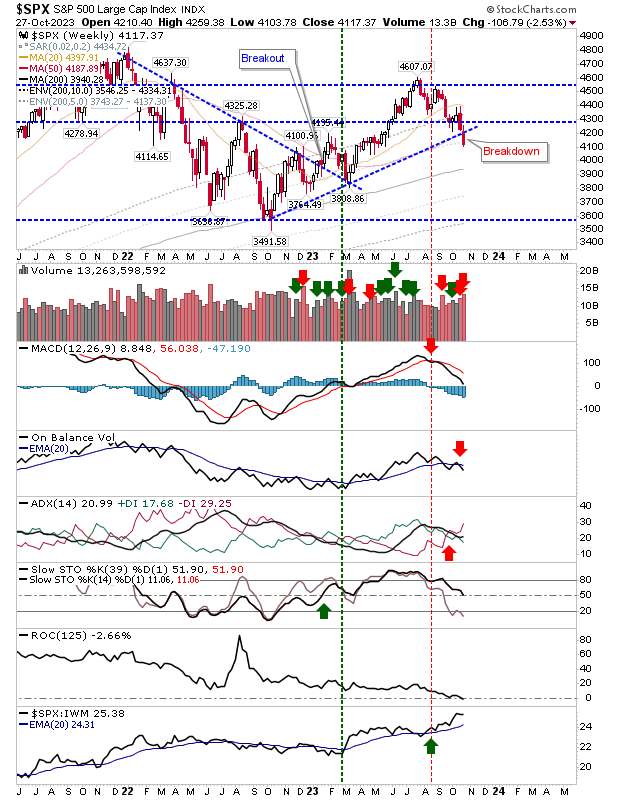
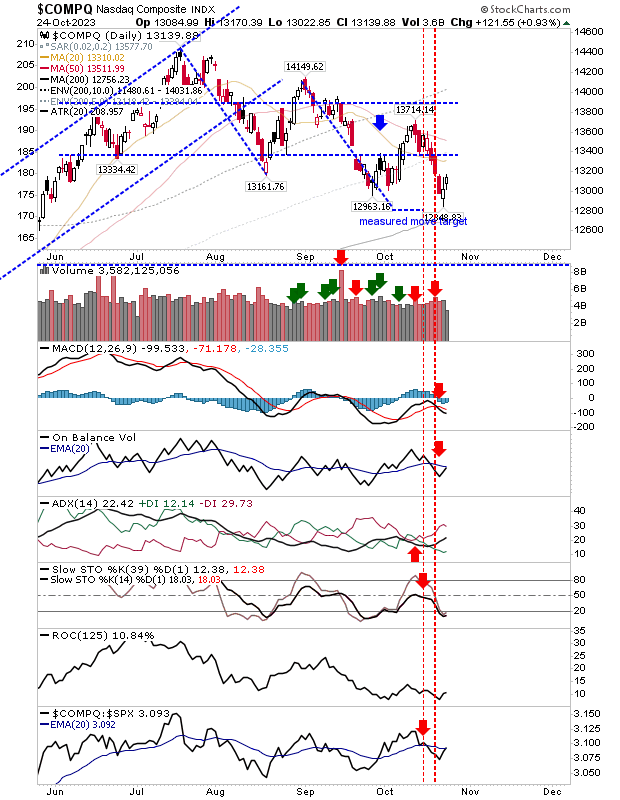
At this stage, only weekly time frames are important as we track "Crash Watch". It's a tricky situation as the S&P and Nasdaq don't look vulnerable, but the Russell 2000 ($IWM) is really struggling. Starting with the Nasdaq, we have a technical negative picture but it that remains above 200-day MA support. This looks like an index in the process of forming a (multi-year) trading range, but even if this is the case, it's still early days as no trading range boundaries have been set. The S&P tagged its 200-day MA, returning above this moving average after today's close. Buying volume was less than previous days selling distribution, but there are grounds for buyers to step in at a logical support level. The Russell 2000 ($IWM) did manage to post a gain today, but the candlestick was a neutral doji, not one to inspire confidence. Technicals are bearish and oversold and show little sign of a recovery. It's still early in the wee

Archive

Show more