Posts

Selling inevitable, but Russell 2000 retains support

Image
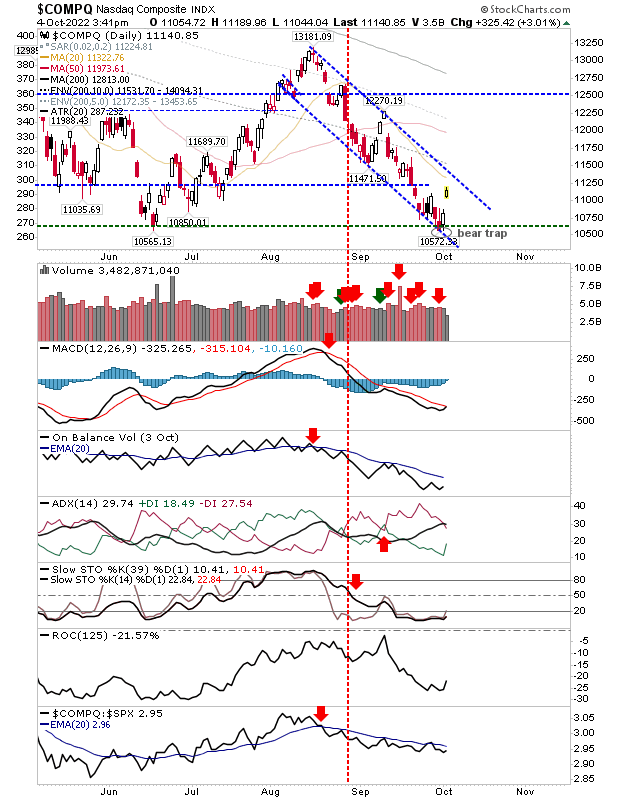
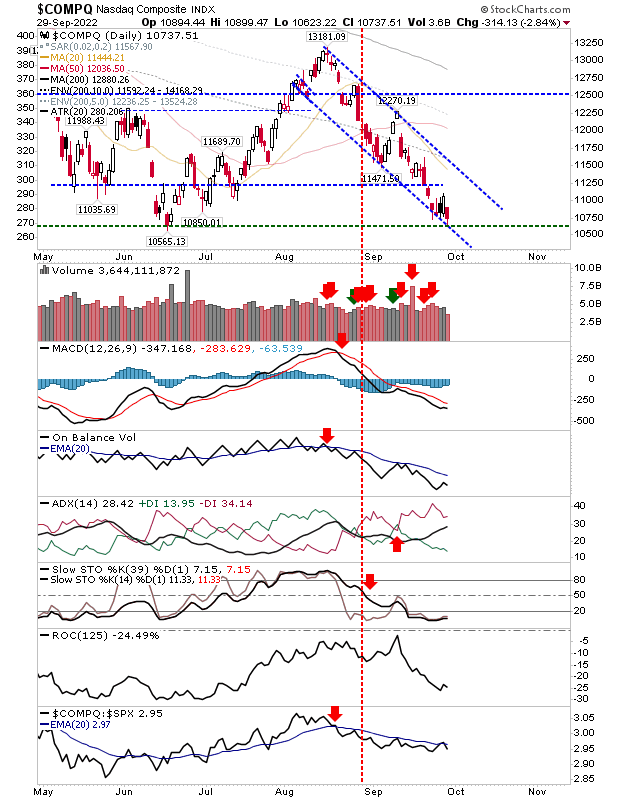
Big bullish engulfing patterns from Thursday were going to struggle to hold their gains, particular as many had started from below support established by the June swing low, and all had come on the back of two months of selling.  With the Nasdaq, the selling had pushed down to half the height of the engulfing pattern and returned the MACD to a 'sell' trigger. Other technicals continue to worsen, but at least selling volume was down on the previous day's accumulation.

Bullish Engulfing Patterns Across Russell 2000, S&P and Nasdaq

Image
Will today be the day markets get their latest swing low?  The Russell 2000 continues to be the index to offer most for bulls as support of $162.50 held firm.  The large white candlestick was supported by strong buying volume, but if anything, today's candlestick was *too* big and is vulnerable to getting pegged back tomorrow.  Technicals in the Russell 2000 weren't vastly improved by today's buying.  The MACD still has its 'buy' trigger but didn't advance much. On-Balance-Volume has been trending down throughout September and October and today's buying, while welcome, didn't make a huge dent in that trend.  The one real positive for this index is the continued improvement in relative performance to the Nasdaq and S&P.

Lots riding on the Russell 2000

Image
After a long weekend away markets decided to undo the gains they had enjoyed in the early part of last week. It was a damaging loss, with both the Nasdaq and S&P both experiencing undercuts of support - negating what had been positive 'bear traps'. Whatever remnants of support the June lows offered for these two indices is no more, we are now looking at what the current trend (lower) from August highs can offer.  The only index to offer some level of optimism is the Russell 2000, which managed a higher close on Tuesday and is still above June lows.  No surprise to see Small Cap growth stocks surge in relative strength - not to mention, it registered as a day of accumulation.

'Bear Traps' for the Nasdaq and S&P as Russell 2000 holds above support

Image
Buying in the Nasdaq and S&P delivered important 'bear traps' which in part, probably fueled today's gap highers in these indices. There is still alot of work for bulls to do, not least drive breaks of downward channels - not to mention, clear the first of the key moving averages in the 20-day. But it does give indices some respite from the grinding selling of the last couple of months.  The buying in the Nasdaq didn't register as accumulation, but there is a slow improvement in the technical picture with an upcoming 'buy' in the MACD.

Friday delivered the selling the prior weeks close suggested would occur

Image
It was going to be a tough week for markets when weekly charts were piling on the pressure.  For example, the S&P weekly chart closed with a series of red candlesticks that finished on the 200-week MA.  It's an ugly chart, but we may be in a position to see a bullish reversal; watch for a late week rally next week assuming a weak start.

Yesterday's relief bounce negated in one day

Image
It was always going to be a tough sell given the speed at which markets pushed down into a retest of June lows last week, but I would have thought a bounce would have lasted longer than a day.  The Nasdaq hasn't violated the June low yet but with Friday's end-of-week print likely to see additional pressure into the overweekend-hold price, it's not looking great for tomorrow.

No bounce, markets set for more losses

Image
After Friday's close I would have expected some form of bounce - either today or yesterday - but this didn't happen. On the (somewhat) plus side, there was no undercut of support of June lows for our monitored indices, although the Dow Jones Industrial Average did undercut such support last Friday and it didn't get much better day with another standard bearish candlestick today.

Archive

Show more