Posts

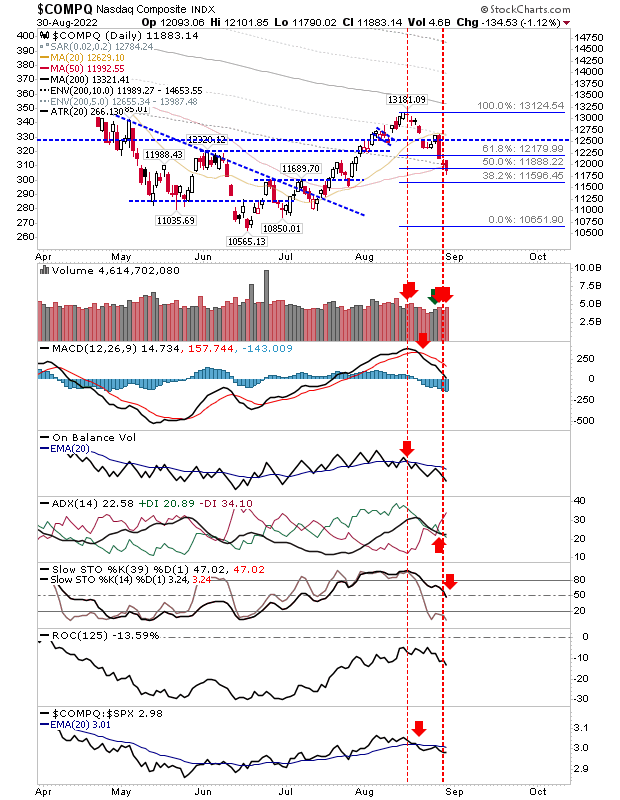
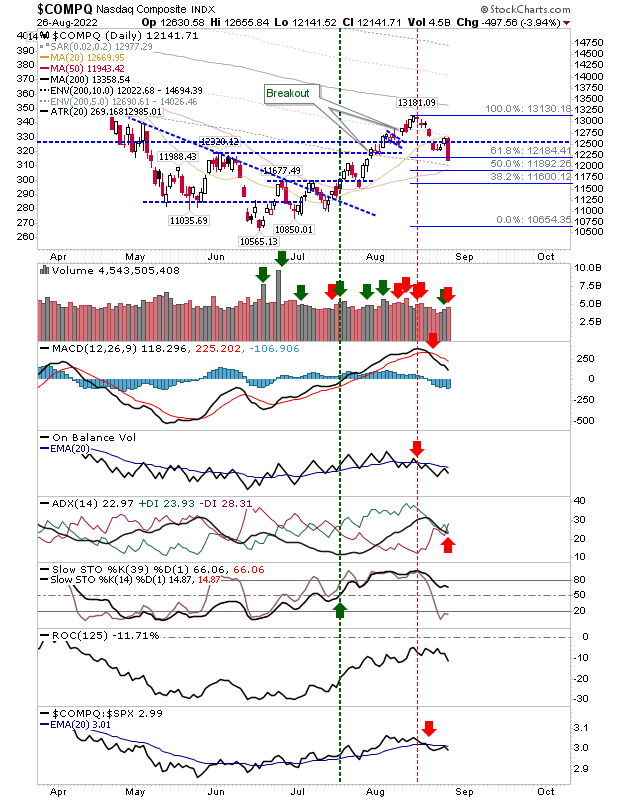
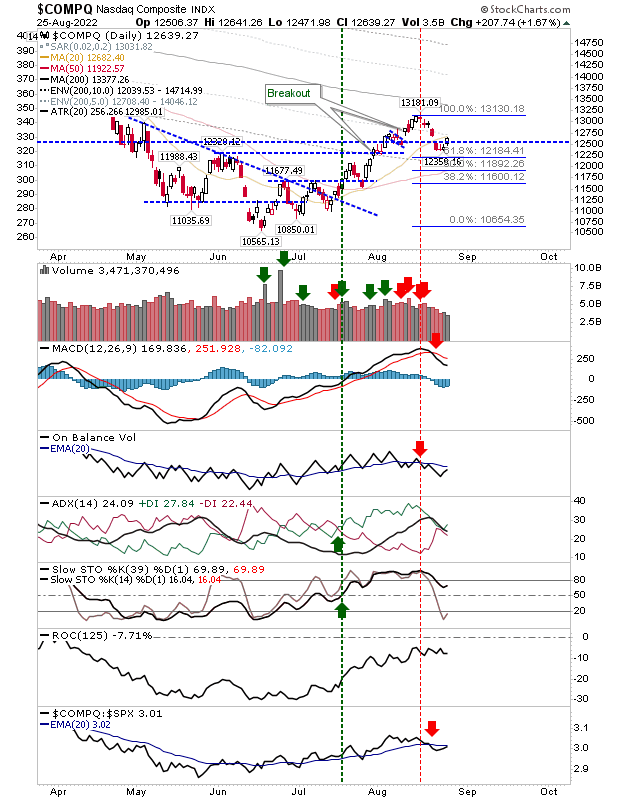
Silver lining? Bullish hammers at Fib retracements for lead indices

Image
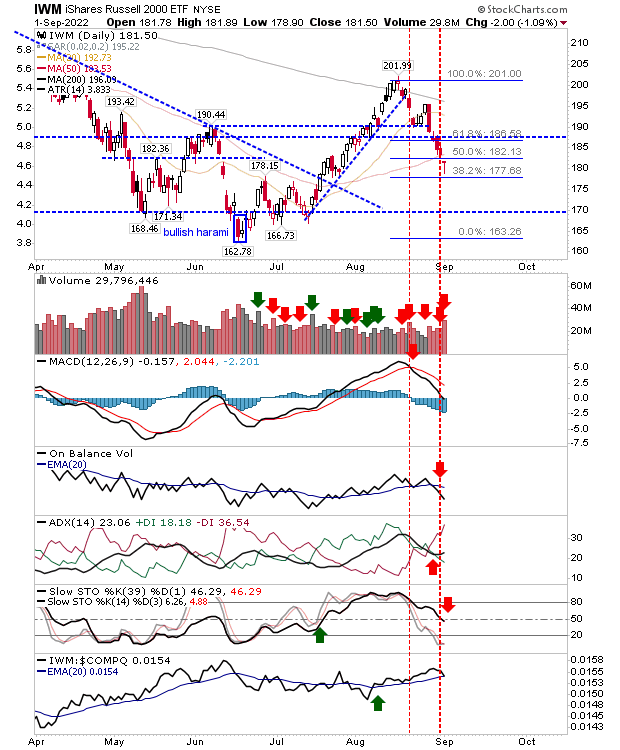
If there was a setup for a bullish reversal in the indices then today was the day.  The Russell 2000, Nasdaq and S&P all closed with bullish reversal candlesticks down at the 61.8% Fib retracement of the move from June through August.  However, any further loss would open the possibility for a complete retracement to the June low. The Russell 2000 finished the day with a doji on higher volume distribution.  Stochastics finished just below the mid-line, resulting in a net bearish technical picture - but these same stochastics are at a level where rallies in bull phases occur (the Russell 2000 having jumped to the bullish side of this equation in July).

50-Day MAs tagged - now let's see what happens...

Image
I've been looking for these tests of 50-day MAs since the reversals off 200-day MAs.  These tests have coincided with moves into 50% Fibonacci levels which increase the possibility of support kicking in.  While the tests of welcome, the 'how' of these tests is less so. Ideally, I would like to have seen more bullish candlesticks, but this was not the case. The Nasdaq had a standard bearish sell off on confirmed distribution, with the added trouble of a return of net bearish technicals. If I had a preference, it would be for a 'bullish'  hammer with a close above today's close. 

Zig-zag correction to test 50-day MAs for S&P and Co.

Image
There was no doubt which side had control of markets on Friday.  Bears stepped in and sold stock in volume on Jerome Powell inflation comments. Futures remain testy heading into Monday so we have to re-consider the outlook for the markets.  I had thought last week's mini-rally was coming a little early with a preferred move for 50-day MAs test as part of a move into Fibonacci retracements (for the move off June lows).  Friday's selling did bring markets into the upper levels of the Fibonacci retracement, and with weak Futures, we could see 50-day MA tests early next week. The Nasdaq was the weakest index heading into Friday and suffered the biggest percentage loss on the day. There was no surprise to see distribution control volume with ADX moving to a new 'sell' in line with 'sell' triggers in On-Balance-Volume and the MACD.  The index continues to underperform the S&P.  I would be looking for the Nasdaq to test its 50-day MA first, which would be an ideal

Early Risers

Image
Buyers stepped in to give markets a boost with the S&P going as far as to register an accumulation day.  Today's gains still feel a little early in the game but whatever the cause, the move higher can't be ignored.  This may be part of an a-b-c style, zig-zag move into Fibonacci retracements but much depends on what happens when indices make their second test of 200-day MAs.  The Nasdaq had the biggest gain on the day, but the buying wasn't enough to register an accumulation day and it didn't quite recover its 20-day MA. Aggressive shorts may look to target the 20-day MA but a move back to 13,181 can't be discounted as part of this mini-rally; so keep stops tight if using the 20-day MA for entry.  Note, today's gain did little to recover the 'sell' triggers in the MACD and On-Balance-Volume. 

Archive

Show more