Posts

S&P Readies for Breakout

Image
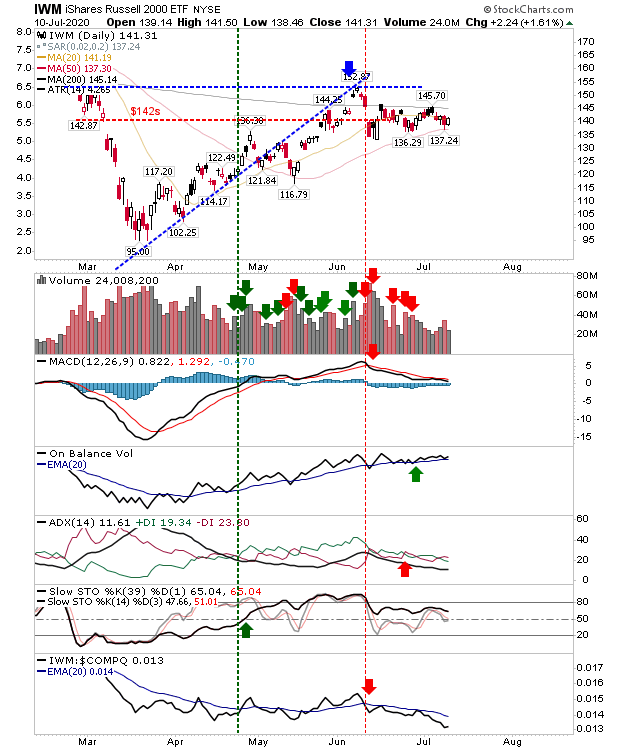
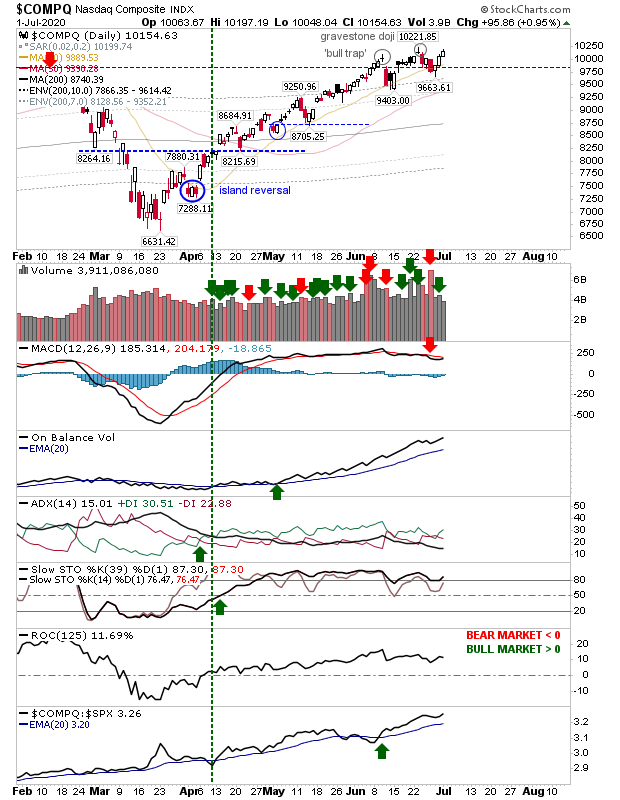
With the week behind us the S&P stood poised to break to new highs for the recovery rally,  following the lead of the Nasdaq which is already posting new multi-year highs. The Russell 2000 is looking a little more tentative as it remains below its 200-day MA on bearish MACD, ADX and relative performance.

Nasdaq Moves To Challenge "Gravestone Doji" High

Image
The Nasdaq has been leading indices throughout 2020, even the sell-off caused by Covid19 was not as bad as was inflicted on the Russell 2000 or S&P. The latest gains are challenging the most recent swing high which was marked by a "gravestone doji" in addition to building on the break of 10,000. On-Balance-Volume is leading the indicators with a strong accumulation trend. 

Buyers attempt to defend support

Image
Sellers had managed to push indices back to support levels where buyers are looking to make a stand.   The S&P is down at the June swing low which is also the 50-day MA. Technicals are a mix of bullish and bearish signals; the index is still underperforming against Small Caps. Selling volume in recent weeks has sided heavily with bears but On-Balance-Volume hasn't yet switched to a 'sell' trigger.  This is as good as place as any to stage a bounce and take on a low risk trade. 

Markets ease back from breakouts

Image
The week ended for markets with sellers in control. The damage was sufficient to put markets on warning for a bearish reversal - but the last such attempt in early June was quickly reversed by buyers; will this time be different? The Nasdaq lost its breakout with a drop below 10,000 and support of 9,800. Part of this move also undercut its 20-day MA. Volume rose in confirmed distribution in one of the heaviest trading days of the year not attributable to options expiration. An effective flat-lined MACD switched to a 'sell' trigger, so this is vulnerable to whipsaw as other technicals remain firmly bullish. 

Archive

Show more