Posts

Semiconductors Breakout

Image
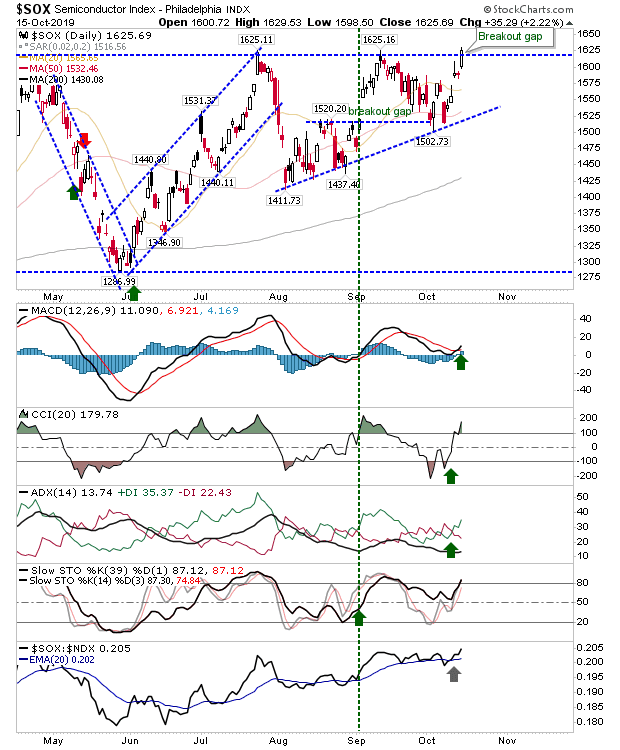
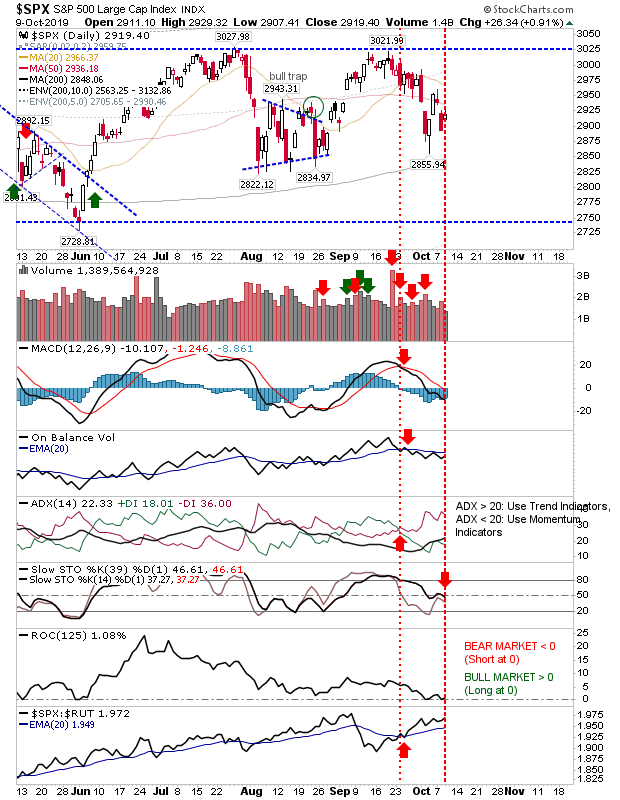
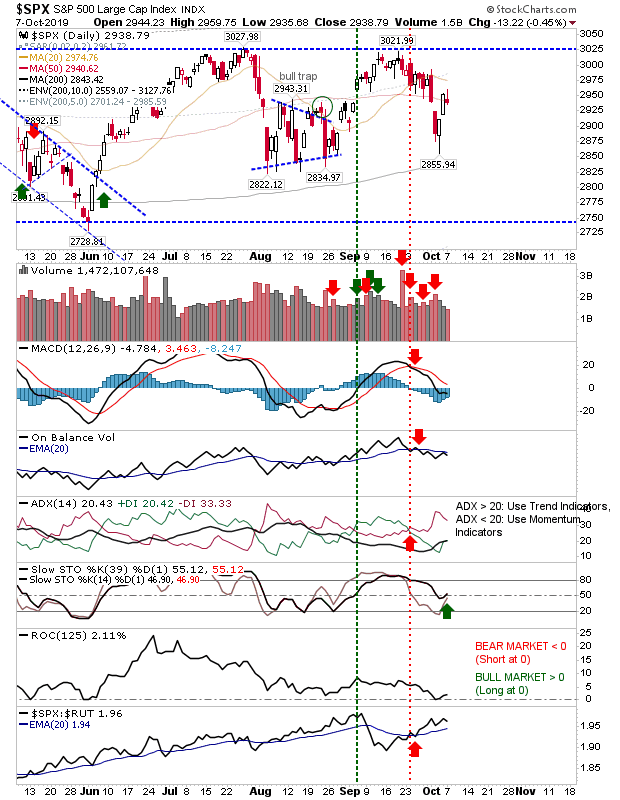
There is a potential lead out for other indices with the Semicondictor Index breaking resistance which will help the Nasdaq and Nasdaq 100 mount a challenge of resistance. Large Caps enjoyed higher volume accumulation as money flowed into defensive stocks. With the exception of the Semiconductor Index other indices are still range bound so again, the importance of up or down days won't become apparent until the trading ranges are breached. We will start with the Semiconductor Index. The index has breached 1,625 with a return to net bullish technicals.

Gains Stall After Positive Friday

Image
Again, everything is viewed through the window of a trading range and until this is breached it's mostly noise in a teacup. The S&P opened at its 20-day MA and rallied to just shy of 3,000 before it ran into trouble. The index eased back to its 20-day MA, leaving behind an inverse hammer, but not before the attempted rally was able to generate new 'buy' signals for On-Balance-Volume and Slow Stochastics

Trading Range Remain as Indices Start To Coil

Image
Market are shaping into small pennants/coils as last week's losses shape into a set of inside days. For indices testing 200-day MAs, the reaction bounce has now stalled as markets search for the next move. In the case of the S&P, today's reaction to the bounce has been somewhat disappointing with an inside day which failed in its attempt to challenge overhead 50-day MA resistance. Technicals have also move into net bearish territory. It looks like the next move down, but a close above the 50-day MA would likely be enough to see a challenge on 3,025.

Market Rally Runs Into Resistance

Image
After Thursday and Friday's gains, today saw the brakes applied with a stall in the rally. The S&P came up to resistance at the 50-day MA and even managed a recovery of slow stochastics [39,1]. There are bearish 'sell' triggers for the MACD and On-Balance-Volume, counterbalanced by an uptick in relative performance against the Russell 2000.

Sellers Put Some Distance on Prior Action

Image
There was a bit more impetus to today's action as sellers took another swipe at markets. Existing - broad - trading ranges remain the dominant influence but some indices are closer to dropping outside of these ranges than others. The Russell 2000 will likely see a challenge on the August 'bear trap/; if not tomorrow then probably before the week is out. Technicals are net bearish but not oversold, which suggests there is room for more downside and if a crash was to emerge then it's not going to happen until the index is oversold.

Sellers Return Again With Russell 2000 Hit Hardest

Image
There was another sweep lower as indices returned to, or swept aside, moving average support. Hardest hit was the Russell 2000 as it undercut both its 50-day and 200-day MAs. The index is charging towards 1,465 support with little in the way of technical support to lean on. Stochastics are at the mid-line which is historically a bounce level for stocks in bullish markets, but it would seem unlikely this will happen here.

Markets Extend Losses

Image
Friday belonged to Bears as sellers finished the week in control but bulls still have support to lean on in the shape of moving averages. The S&P is leaning on the 50-day MA with 'sell' triggers in the MACD, On-Balance-Volume, and ADX, although relative performance ticked up against the Russell 2000. Volume rose in confirmed distribution. Monday is a fresh chance for bulls to recover the losses.

Archive

Show more