Posts

Semiconductors Break Upside From Pennant Consolidation

Image
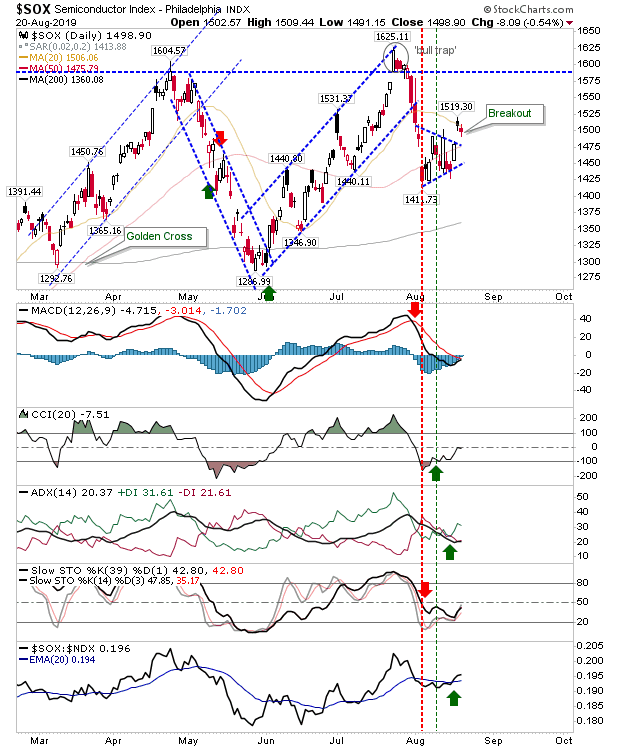
In attempt to break the deadlock of the recent consolidations, the Semiconductor Index gapped above its pennant. Today's losses didn't close the gap, keeping the bullish move intact - for now. New support is 1,412. The next challenge is 1,605.  The relative performance advantage of the Semiconductor against the Nasdaq 100 ticked higher with further gains in the CCI and +DI/-DI

Intraday Volatility Expands But Indices Remain Range Bound

Image
The past week saw lots of big one-day changes, but from the context of where indices lie there was little to say other than it generated a whole tonne of noise. For the S&P, daily swings were contained by the lead moving averages (20-, 50-day above and 200-day below). Again, the key price zones to determine if we will have a new bear market or continuation bull market are 3,025 and 2,750. Technicals reflected this mess with a new 'buy' signal in On-Balance-Volume while the MACD remains firmly bearish as stochastics [39,1] and [14,3] converge in oversold territory. The index has accelerated its relative performance against the Russell 2000, suggesting that when money move into the market it's doing so in favour of Large Cap stocks (not a ringing endorsement for the secular bull rally to continue).

Volatility reigns but a bounce looks favored

Image
The past few days have been a marked turn from the steady gains of June/July. There does look to be a making of a swing low with some indices knocking near their 200-day MAs. The S&P finished with a bullish hammer with a spike low that suggest 2,820s will be defended by buyers. The 200-day MA around 2,790s is an alternative so few the range between these two values as a thick paint brush of support. Volume climbed today to register as accumulation but other technicals are net bearish with the exception of relative performance against the Russell 2000 which ticked higher; money shifting into defensive stocks.  Stochastics are collectively oversold, so today's bullish candlestick at an oversold condition does suggest we will see higher prices tomorrow.

Markets Whacked

Image
Big losses swept the market as the Chinese trade war was blamed for today's decline, but Trump chaos has been influencing the market for a long time and the failure of the June breakouts is a more likely cause of the continued selloff. For the S&P, the next move is heading down to retest the June swing low of 2,728.  Technicals are net bearish and losses were less than hit the Russell 2000 so it has actually managed a relative gain. Before it gets there, the 200-day MA is first up.

Archive

Show more