Posts

Bulls Make Solid Gains

Image
A solid close to the week helped advance Thursday's recovery. Tech Averages had the best of the action. Any short trades should be covered as the nature of the price action has shifted more sideways/bullish. The Nasdaq 100 cleared declining resistance with a new bullish cross in relative performance. There was also a 'buy' trigger for On-Balance-Volume and MACD. Next tests are 6,856 and 7,000.

More Demand Buying

Image
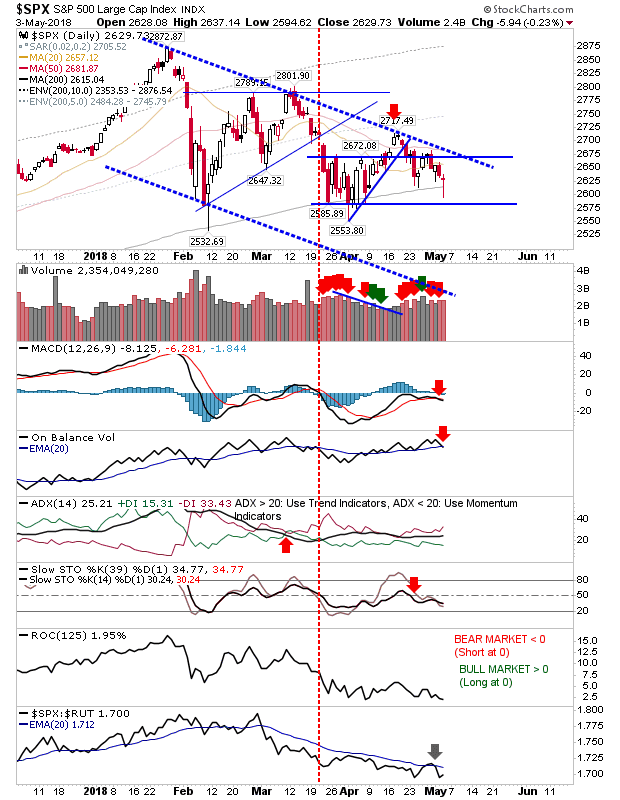
Tuesday's round of buying didn't last long as sellers took another swing at pushing prices lower yesterday. However, today's buying was a little more appetizing for bulls. The S&P generated another spike low, this time with a doji at the 200-day MA. Technicals did turn net bearish and relative performance has remained weak since the larger triangle/wedge breakdown in March.

Better from Bulls - Shorts Failing to Apply Pressure

Image
Since the breakdown in wedge support it had looked easier for bears to push indices down to 200-day MAs or lower channel support but action over the last week with two bullish hammers suggests longs may have a launch pad to work with. The S&P is offering a nice setup with the 'bullish hammers' just above the 200-day MAs. The only disappointment was the 'sell' signal in relative performance in the Russell 2000.

Mixed Setups; Something for Bulls and Bears

Image
Markets started the day strong - challenging resistance - but were unable to press this advantage.  Many indices closed lower, leaving 'black candlesticks' which are typically bearish when formed at 'swing highs' but still favor weakness even in the absence of the swing high setup. The 'black candlestick' for the Nasdaq at resistance suggests a move towards the 200-day MA but for this to happen there needs to be an immediate downside; any recovery has a strong chance of negating the 'black candlestick'.

Archive

Show more