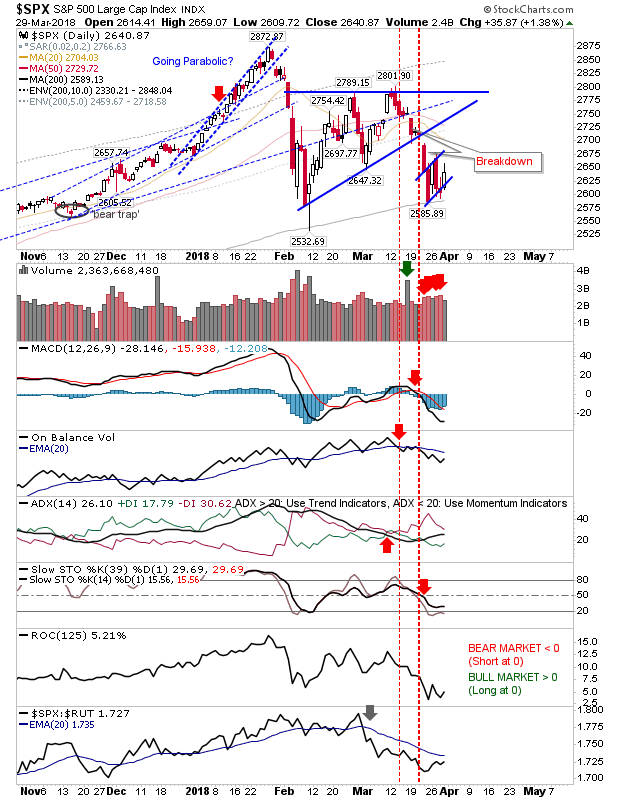
Posts

Dow Breakout

Image
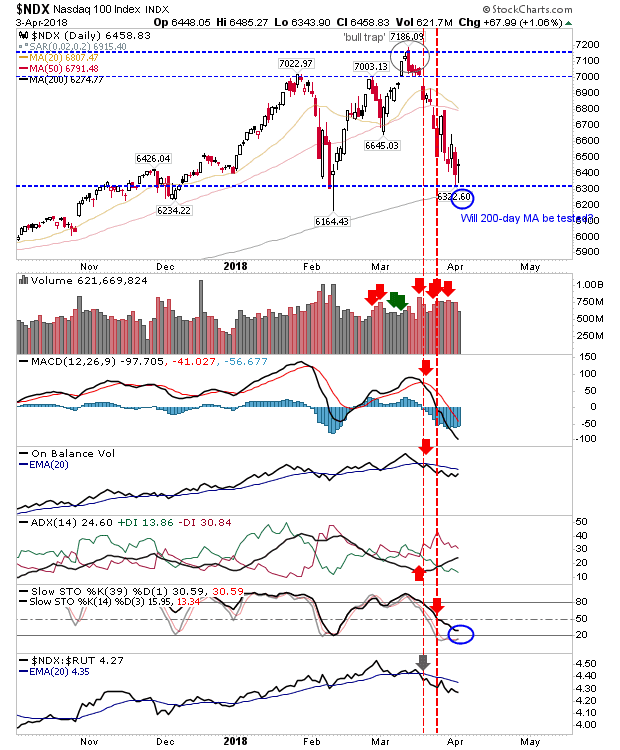
Markets look to have found a new routine with 200-day MAs acting as working support. The 'bear flags' I had marked for the S&P and Dow Jones Industrial average look toast given the latter index has broken resistance from what now looks to be a horizontal consolidation. However, the larger consolidation from all-time highs has yet to be challenged but could see a test Friday or Monday.

Bullish Harami Crosses Offer Swing Low Potential

Image
Today's action didn't break the bounds of Friday's range but did create a scenario where solid swing lows develop; bullish harami crosses are one of the most effective swing low markers. The best opportunity can be found in the Nasdaq 100. A rally from here would suggest the makings of a trading range which I have marked in the chart below. The typical stop is a loss of 6,320 but I would use a decisive break of the 200-day MA as a stop.

Blog Traffic Picks Up as Bears Take Control

Image
Blog traffic has doubled over the last three days as 'panic reading' takes hold of the market. Such spikes in readership have in the past acted as good points for a near-term bottom, although today's action does not suggest as such. The S&P and Dow Jones both offered breakdowns from their respective 'bear flags'. The S&P broke from the 'bear flag' and closed just below its 200-day MA. Volume climbed in distribution although there is enough to suggest this could be a support level.

Bulls Try To Stabilize Market

Image
Tuesday's sell-off did much to rattle the confidence of bulls; Thursday's attempt to bid markets back to Tuesday's highs lacked confidence as demonstrated by the relative gain and the lighter volume. Friday is an opportunity to give markets a little boost heading into the Easter weekend.  Futures suggest a positive open so it will be a question as to whether markets can build on it. The S&P is still shaping a 'bear flag' on the bounce off the 200-day MA. While technicals are net bearish they are not oversold.

Archive

Show more