Posts

Daily Market Commentary: Bullish Recovery

Image
It was looking a little worrisome for the Russell 2000 after sellers pushed the index below Monday's lows in early action.  The index gave back some of the recovered gains by the close, but not enough to reverse what amounted to a bullish hammer. Intermediate and short term stochastics are oversold, but there is no reason to suggest these will contribute to an immediate bounce. The 'bullish hammer' will offer a long side opportunity on a close above the high, risk based on a loss of its lows.

Daily Market Commentary: Bullish Challenge

Image
After yesterday's action it was no surprise to see markets claw back a small amount of those losses. Buying volume dropped, a trend which has been apparent since the failure of the S&P to break above 1,850. Technicals in the S&P are oversold, offering am opportunity for a bounce with relative strength swinging sharply in favour of this index.

Daily Market Commentary: Buyers Go Into Hiding

Image
The battle between bulls and bears finally resolves itself in favour of bears. The end result differed by index, with some performing 'better' than others. Bad economic data was blamed for the fall, but this is a rally long in the tooth, and in need of a decent move lower to address the complacency built into this rally. The S&P decisively sliced through 1,770 support, barely pausing at a level bulls had, up until today, defended with relative ease. Selling volume climbed into yet another decisive distribution day. The 200-day MA is looking very enticing as a test level, although the market is oversold and short and intermediate term levels.

Daily Market Commentary: Heavy Volume Distribution - but - Support Holds

Image
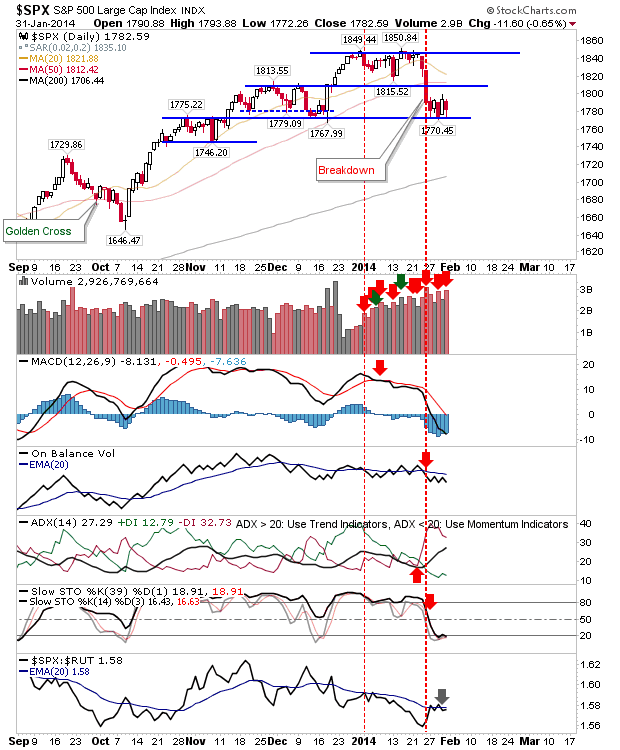
One should give the edge to support - for now - but trading volume has consistently picked up in favour of distribution on days the market has closed lower. The S&P experienced another heavy distribution day as bulls kept the index above 1,770.  Technicals are net bearish, which means rallies should be sold into.  The 20-day MA is the area to attack if a short or looking to take profits on a support bounce.

Sector Analysis: Utilities Out in Front

Image
Not surprisingly, there has been a dramatic fall in the level of bullishness within sectors over the past 10 days. However, one sector which has managed to keep its nose in front is Utilities ($XLU). Select the 'Utilities' option in the bubble chart below (don't work in Firefox - talk to Google/Firefox as to why!), and watch how it moves from a middling, slightly under-performing, sector to sector leader.

Daily Market Commentary: Bulls Try Again

Image
Tuesday's halt of the decline didn't stick, but Thursday's buying looks to have more metal behind it. For starters, the Russell 2000 rallied enough to create a 'bear trap'. The index now has a 'bear trap' and a 'bull trap' to contend with. But bulls have a handy edge, with the 50-day MA to become Friday's battle, and the 20-day MA next weeks'. Stops go on a break of 1,119.

Daily Market Commentary: A Bearish Twist

Image
It proved to be a tough day for bulls. Shorts are unlikely to have been the cause of today's losses, although some may not have wasted time jumping on board. Apple's poor results were probably a cue for some long-term holders to bail out, although Fed action and international currency woes were also put forward as excuses, but collectively, this caused the nascent rally to breakdown.  Volume climbed in confirmed distribution, setting up tomorrow for more of the same. Technical weakness in the S&P intensified, although bulls will look to a third day of held support despite the 1% loss on the day. Aggressive longs could look to buy this support on Thursday with a relatively tight stop available. Again, if there is any downside follow through on today, you probably wouldn't want to hold long into the morning session if no fightback was observed. However, a gap down at the open would be an interesting long opportunity.

Archive

Show more