Posts

Daily Market Commentary: Volatility and Volume Increases

Image
It was to be expected at some point after the holidays, volatility would increase.  However, Tech averages had a relatively quiet day, although the semiconductor index had a wobble of its own. For the S&P (and Dow), the increase in volatility left the index flat by the close. The index finished on former upper channel resistance-turned-support, with the 20-day MA also seeing a positive test. However, technicals weakened further with 'sell' triggers in On-Balance-Volume and +DI/-DI, with volume picking up to register a confirmed distribution day.  Short term is set up for a bounce, but if this bounce doesn't reverse the technical 'sells', then a larger decline is likely. A close below the 20-day MA today or tomorrow would kill the short term bounce too I think, perhaps bringing in a larger test of the 50-day MA.

Market Sentiment: Inter-Sector Breadth Analysis

Image
Finally put together my sector breadth analysis to include change over time ( Looks to only work in Chrome - Timing Out in Explorer and Firefox - cross domain issue? ). Google's bubble chart working very nicely and there are lots of customisation options, including tabbed histograms.  Last 10-days with Bullishness, Sector Rank, Price Change and Price to choose from.  You can also track the trails:

Market Sentiment: Sectorbreadth

Image
Split sector performance: Defensive sectors gain, Cyclical ones lose out. Utilities ($XLU) on the rebound. 

Daily Market Commentary: Conflicting Day

Image
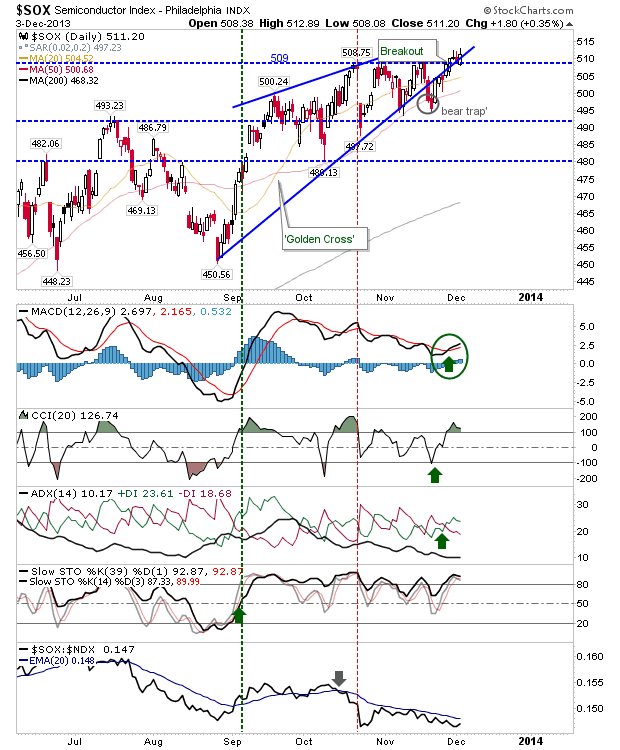
It was a case of selling for many of the indices, with the exception of the semiconductor index.  The semiconductor index has been a long time underperformer, but today it held on to its breakout with a modest gain. Technicals are also in good shape.  If there was a marker as to where to place your bets for a Christmas rally, Tech would look to be the place to be.

Market Sentiment: Sector Breadth.

Utilities remains on its own. Other sectors still clustered, although weakening slightly from last week. Buying opportunity exists when sector drops below 10% bullishness - Utilities at 15% currently. Minor ranking changes don't point to any potential trend shift.

Daily Market Commentary: Big Loss in Russell 2000

Image
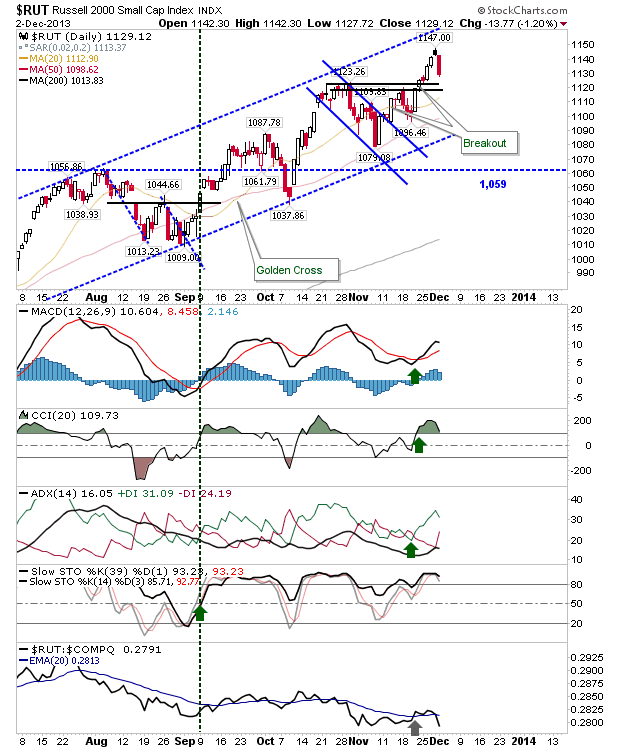
Trading volume was not particularly excessive as traders slowly crawl back to their trading desks after the holidays. However, what action there was sided with bears. The small cap, Russell 2000, took the largest hit on the day, down over 1%. However, losses remained confined to the larger bull trend, so the real damage was relatively light.

Happy Thanksgiving!

Image
Back on Monday...

Archive

Show more