Posts

Stock Market Commentary: 20-day MA Support

Image
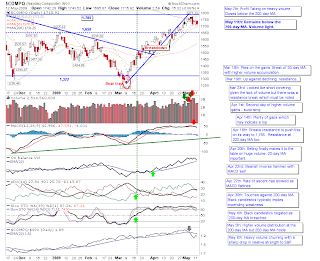
The Nasdaq lost some, gained some, then lost a little again - but none of it broke below the 20-day MA. The next few days will mark the battle between support of the 20-day MA and resistance of the 200-day MA; these two lines are squeezing together, a violent response is expected. Large caps remain caught between 20-day and 200-day MAs with room to move either way: The Russell 2000 flashed 'sell' signals in supporting technicals: Most worryingly for tech, semiconductors took another substantial hit but the 50-day MA held as support How will it break? Dr. Declan Fallon, Senior Market Technician, Zignals.com the free stock alerts, stock charts, watchlist, multi-currency portfolio manager and strategy builder website. Forex data available too.

Swiss Franc Trust ($FXF) leading Euro Trust ($FXE) with Breakout

Image
Can't remember where I got this pairing from but I think it was Corey at AfraidtoTrade . When one breaks the other usually follows suit. We have a situation where the Swiss Franc Trust ( FXF ) has broken from its recent base; setting up a potential move to 101.15. But it also augurs well for the Euro Trust ( FXE ) which has yet to emerge from its base. However, you can follow the action by saving this chart to your Zignals account here and creating an alert to go off on a Price Break of $137.41 . See us on Chart.ly ; feel free to retweet me! Dr. Declan Fallon, Senior Market Technician, Zignals.com the free stock alerts, stock charts, watchlist, multi-currency portfolio manager and strategy builder website. Forex data available too.

Stock Market Commentary: Tale of Two Cities

Image
For Large Caps it was a hasty retreat but for Tech not much happened. Large Caps stayed on course to reach their 200-day MAs as Tech averages struggled to hold theirs. Most worryingly, the Semiconductor Index, having breached rising support from March lows now finished Monday below its 200-day MA. The Semicondutor index is now looking at the 50-day MA for support. This creeping weakness has impacted on the Nasdaq and Nasdaq 100 with the MACD trigger 'sells' in the aforementioned indices. The Dow is lagging nearly all of the key indices but has now started to outperform Tech markets even on the back of Monday's down day. Look for further cycling of money out of Tech into the relative safety of Large Caps over the next couple of weeks. Dr. Declan Fallon, Senior Market Technician, Zignals.com the free stock alerts, stock charts, watchlist, multi-currency portfolio manager and strategy builder website. Forex data available too.

Weekly Stock Charts review from Stockcharts.com Publishers

Image
Rally keeps its feet in the air. Battleground defined by 200-day MAs. What had the Stockcharters to say about it. Top of the pile this week (for the first time) was Tomas Lesxczyski of Santoren.com . Interesting band analysis of the 60-min SPX; moving to a new elevation - but will rollover once top band is tagged? I like the bottom bounce call here; one more down leg to come? Positive turn in accumulation after the SPY has tacked on considerable gain! Yong Pan of Cobrasmarketview has mostly neutral signals in the short term with a mix of bull/bear on the intermediate time frame; probably not as toppy as the charts look? Yong Pan has cued for a major move based on tightening of B.Bands. 'Sell' signal in the daily SPY: Breadth remains on the 'buy' side: I really like the call for a head-and-shoulder reversal on the weekly; 750 looks a good place for support on a retracement. Anthony Caldaro of Elliot Wave Blog offers up a more negative prognosis on the monthly S&

Weekly Market Commentary: Bullish Percents at Peak High

Image
The Nasdaq Bullish Percent is likely to weaken next week (which will come with a sharp decline). However, this may not materialize into a longer downtrend but instead repeat the early part of 2007 where breadth diverged from the indices as it does now. The 2007 bearish divergence was an early warning to the troubles that followed - even though the Nasdaq rallied for another 9 months. The current bullish divergence for October-March lows between the Nasdaq and Nasdaq breadth suggests somethings similarly large could be in the works (on the bull side), even if the market makes another run on March lows. The S&P Bullish Percents were finally able to break resistance which had long been surpassed for other breadth indicators. It was the last to do so. The Percentage of Stocks above the 50-day MA is in rarified air and has the same strong bullish divergence at play. As for the indices the Russell 2000 is soon to come up against 517 resistance And the Nasdaq 100 is just a few points shy

Nasdaq McClellan Oscillator Bearish Divergence

Image
Although there are a tonne of overbought conditions in various breadth indicators the Nasdaq McClellan Oscillator as added its voice with a bearish divergence kicked off from the middle of March. A bearish cross of the zero line in the Oscillator will coincide with a closing break of the reaction lows trendline (currently just over 1,700); good place for a trailing stop? I have the NYSE for comparison Dr. Declan Fallon, Senior Market Technician, Zignals.com the free stock alerts, stock charts, watchlist, multi-currency portfolio manager and strategy builder website. Forex data available too.

Stock Market Commentary: One Day Loss has Support

Image
The inevitable happened and sellers took control on heavy volume. It's not all bad given the proximity of the first level of support, namely the indices 20-day MAs. For the Nasdaq this means 1682 but the bigger concern is the sharp drop in relative performance against the S&P; it certainly looks like Tech has had its day at least for now. The semiconductor index took the hit hardest but it did fall back to rising support and didn't lose its 200-day MA. However, there was a 'sell' in the CCI and a bearish divergence in the MACD trigger line. The S&P showed what a mediocre day it was for Large Caps. Whatever strength emerges over the next few days will likely be channeled to large caps over Tech stocks, but in the larger scheme of things everything will head down in the short term as overbought market conditions are relieved. Dr. Declan Fallon, Senior Market Technician, Zignals.com the free stock alerts, stock charts, watchlist, multi-currency portfolio manager a

Archive

Show more