Happy New Year!
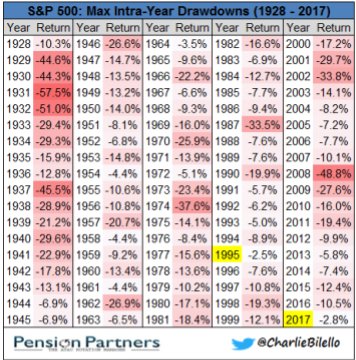
Getting back into the swing of things. I offered a yearly outlook here but this post will focus on the daily charts. It has been more of the same for indices since the pre-Christmas break. Small gains have helped maintain the breakouts established in early December. Volume has been typically light and should pick up into next week.
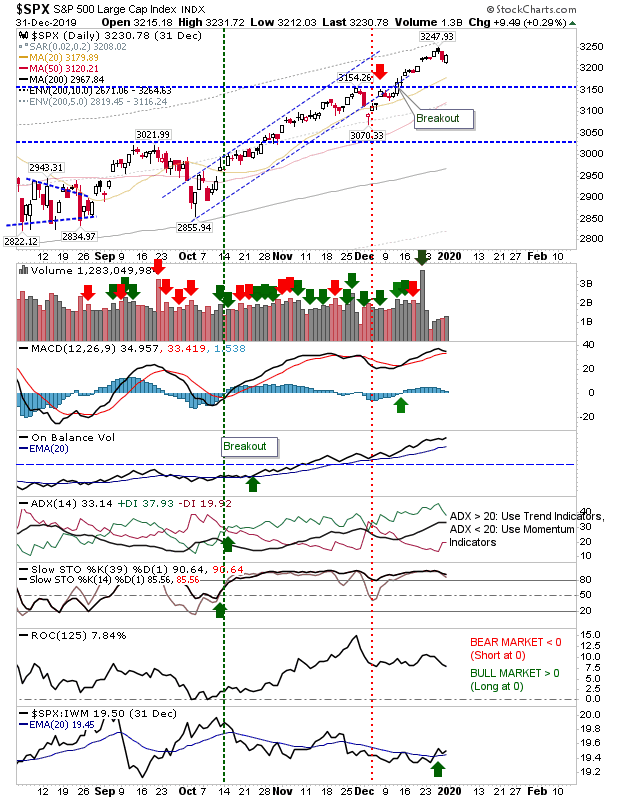
The S&P has continued to hold to its bullish technicals with relative performance now in the ascendancy (versus the Russell 2000).
The Nasdaq has seen slightly better volume and had already enjoyed good technical strength heading into the Christmas period and now is no different. There was perhaps enough volume on the last trading day of the year to register as accumulation.
The Russell 2000 lost a little more ground, finishing the year with a MACD trigger 'sell' as it lost more ground in relative strength versus its peer indices. Despite this, the index finished on channel support.
For the Semiconductor Index I have drawn a new rising channel which the index has recently rebounded off. Despite this, it still holds a relative performance advantage against the Nasdaq 100 even if it has lost some ground to this index.
And with that, 2020 begins as 2019 ends. Rallies intact with room to maneuver should sellers make an appearance. I'll post some long term commentary on my Stocktwits Room. Next post will be January 6th.
You've now read my opinion, next read Douglas' blog.

---
Accepting KIVA gift certificates to help support the work on this blog. All certificates gifted are converted into loans for those who need the help more.
Follow Me on Twitter


Investments are held in a pension fund on a buy-and-hold strategy.
The S&P has continued to hold to its bullish technicals with relative performance now in the ascendancy (versus the Russell 2000).
The Nasdaq has seen slightly better volume and had already enjoyed good technical strength heading into the Christmas period and now is no different. There was perhaps enough volume on the last trading day of the year to register as accumulation.
The Russell 2000 lost a little more ground, finishing the year with a MACD trigger 'sell' as it lost more ground in relative strength versus its peer indices. Despite this, the index finished on channel support.
For the Semiconductor Index I have drawn a new rising channel which the index has recently rebounded off. Despite this, it still holds a relative performance advantage against the Nasdaq 100 even if it has lost some ground to this index.
And with that, 2020 begins as 2019 ends. Rallies intact with room to maneuver should sellers make an appearance. I'll post some long term commentary on my Stocktwits Room. Next post will be January 6th.
You've now read my opinion, next read Douglas' blog.
---
Accepting KIVA gift certificates to help support the work on this blog. All certificates gifted are converted into loans for those who need the help more.
Follow Me on Twitter
Investments are held in a pension fund on a buy-and-hold strategy.


