The past week saw lots of big one-day changes, but from the context of where indices lie there was little to say other than it generated a whole tonne of noise.
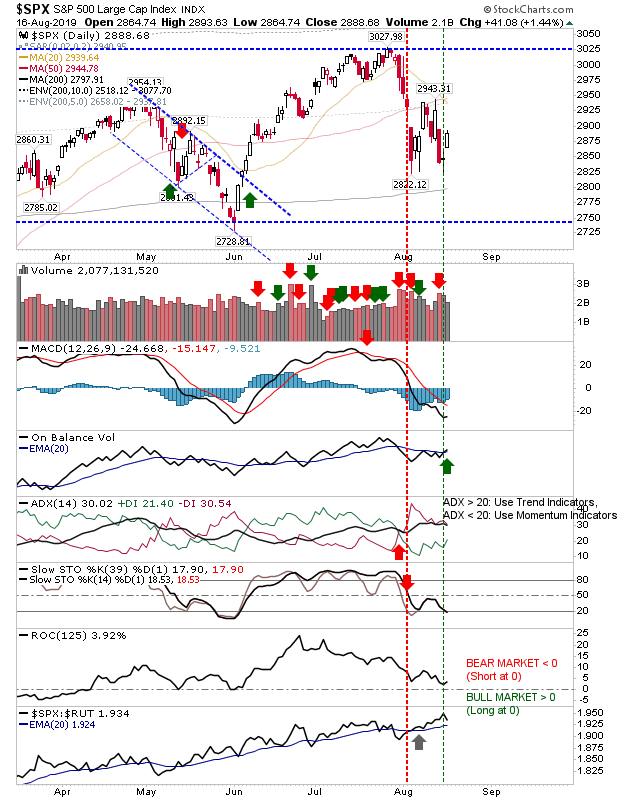
For the S&P, daily swings were contained by the lead moving averages (20-, 50-day above and 200-day below). Again, the key price zones to determine if we will have a new bear market or continuation bull market are 3,025 and 2,750. Technicals reflected this mess with a new 'buy' signal in On-Balance-Volume while the MACD remains firmly bearish as stochastics [39,1] and [14,3] converge in oversold territory. The index has accelerated its relative performance against the Russell 2000, suggesting that when money move into the market it's doing so in favour of Large Cap stocks (not a ringing endorsement for the secular bull rally to continue).
The Nasdaq has a very similar price picture to the S&P; the bear / bull levels marked by 7,300 and 8,300. Technicals are net bearish but there is a nascent uptick in relative performance against the S&P (becoming a potential lead index in the S&P-Russell 2000-Nasdaq axis). Relative performance has so far lacked significance, but it's something to watch in the days ahead.
The Russell 2000 was the first index to make the test of the range boundaries, bouncing off support on the test; but the bounce off support keeps the index inside the 1,465 - 1,610 range that will determine if a new bear market emerges or the secular bull market continues. With the bounce off support there is a potential long signal, but a lower risk candle than the one from Friday will be needed.
In another support test, the Dow Jones Industrial Average made its bounce off the 200-day MA something which the Russell 2000 failed to achieve before it bounced off support of the June swing low. Unlike the S&P, it has no bullish technical markers yet.
The Semiconductor Index is in a position to help the Nasdaq and Nasdaq 100 as it shapes a consolidation pennant around its 50-day MA. It enjoyed a bullish (relative performance) surge through the summer and the latest uptick may offer a cue as to the direction of the break in the pennant.
So there were plenty of fireworks but no resolution as to what will happen next - not until June swing lows or July swing highs are breached will we know.
You've now read my opinion, next read
Douglas' blog.

---
Accepting KIVA gift certificates to help support the work on this blog. All certificates gifted are
converted into loans for those who need the help more.
Follow Me on Twitter
Investments are held in a pension fund on a buy-and-hold strategy.


