Since October's sell-off, down days that racked up losses of 3% or more have garnered much media attention, but the action of the last two days looks a lot more bearish than one of those big sell-off days.
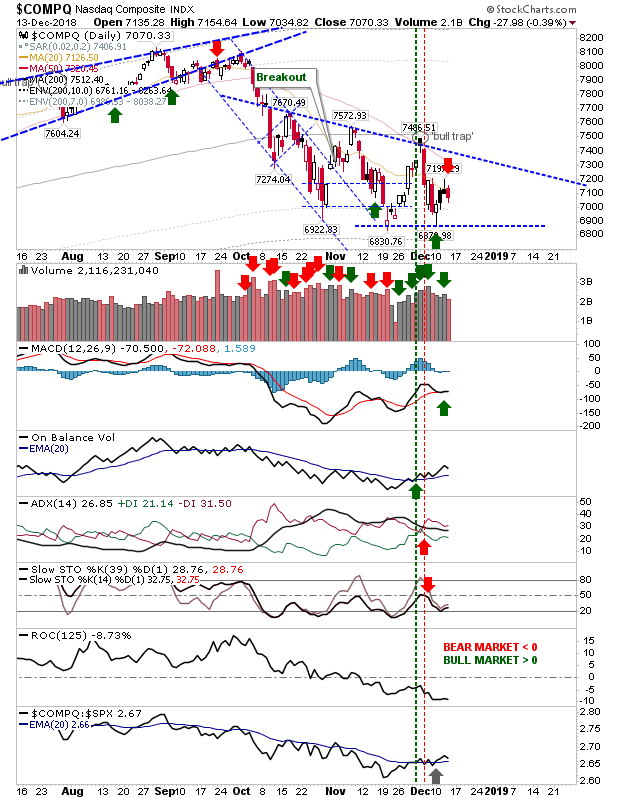
The Nasdaq posted a small bearish black candlestick on Wednesday, which was followed by a small bearish engulfing pattern today. Given this followed from an earlier bullish hammer, it now looks like this bounce is losing momentum and another push towards sub-6,800 is on the cards. There is an uptick in relative performance (vs the S&P) but I wouldn't be looking for this to last.
The S&P is showing a little more indecision with a series of doji following a (deeper) bullish hammer. While not as bearish in price as the Nasdaq it still has to contend with a net bearish technical picture although relative performance is good - which is not surprising given the index's defensive nature.
The biggest hit was made on the Russell 2000. The index lost over 1% with it's smaller 'bullish hammer' close to been negated. This is coming off an earlier support break - the only index to do so. Relative performance is terrible and technicals have been net bearish since September. It's all looking like this index is about to take a big step downwards. Buyer beware.
In other indices, we have Nasdaq volatility make its first bullish cross of the midline in nearly 10 years. This is an ugly chart if you are someone who likes gains and losses of under 1% and steady market advances. Instead, we now look to be entering a new phase of market volatility.
We have also had a breakdown in the relationship between the Dow Jones Industrial Average and the Dow Transports - a bearish breakdown. Transports are struggling, ergo the economy is about to struggle, ergo things are about to get a whole lot worse for markets.
The weekly S&P chart is not giving cause for optimism either. The bullish support of the 50-week MA from early 2018 has now turned into resistance and there is plenty of room for losses before support becomes available.
Let's see what the rest of the Santa rally can bring but lumps of coal are looking like the most likely gift for traders this year. Take your lead from the Russell 2000; bulls will need a 'bull trap' which is a close above 1,465. Shorts can come in here with a stop which is a close above 1,465; i.e. a confirmed 'bull trap'.
You've now read my opinion, next read
Douglas' blog.
I trade a small account on eToro, and invest using Ameritrade. If you would like to
join me on eToro, register through the banner link and search for "fallond".
If you are
new to spread betting, here is a guide on position size based on eToro's system.

---
Accepting KIVA gift certificates to help support the work on this blog. All certificates gifted are
converted into loans for those who need the help more.
Follow Me on Twitter
Dr. Declan Fallon is a blogger who trades for education on
eToro and can be copied for free. Investments are held in a pension fund as buy-and-hold.