Range Trading Continues
Tuesday saw some upside from Monday's recovery but the trading ranges I marked on the charts over the weekend remain valid so no change in the status quo.
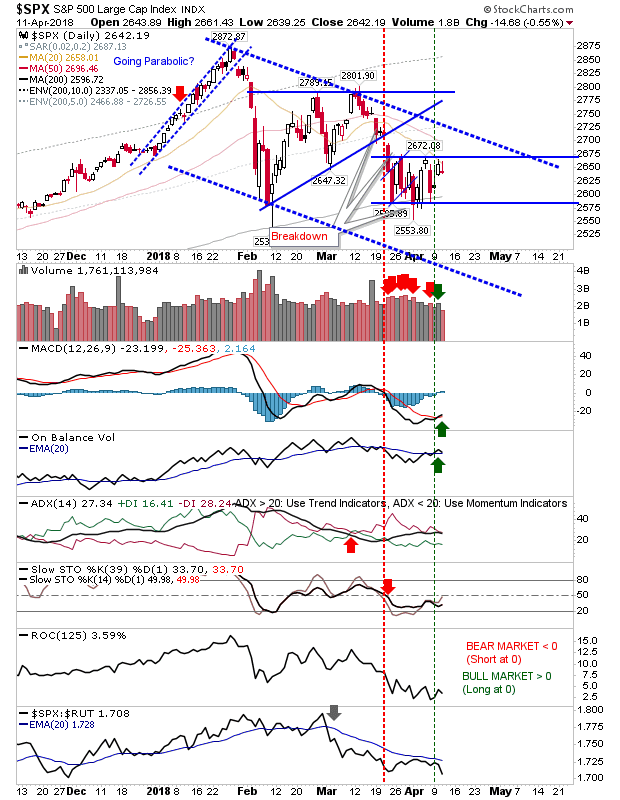
The S&P shows this best with the trading range defined by the former 'bull flag'. Today's close left the index just below resistance. The lower close could suggest another run back to 2,590s.
The Nasdaq is also knocking on the door of resistance. Today's high at 7,128 tagged this resistance level which is also close to 20-day and 50-day MAs. There isn't much room for upside without generating a breakout - a breakout which would nicely set up a move back to 7,500. However, the least path of resistance is down but it will take more than a day's selling to break the trading range.
The Russell 2000 is also up against mini-resistance. I have redrawn a Consolidation triangle which looks a good upside target for the April mini-rally. There is a MACD trigger 'buy' which should help those using technical triggers.
Not much more to add. Tomorrow may offer more guidance.
You've now read my opinion, next read Douglas' blog.
I trade a small account on eToro, and invest using Ameritrade. If you would like to join me on eToro, register through the banner link and search for "fallond".
If you are new to spread betting, here is a guide on position size based on eToro's system.

---
Accepting KIVA gift certificates to help support the work on this blog. All certificates gifted are converted into loans for those who need the help more.
Follow Me on Twitter


Dr. Declan Fallon is a blogger who trades for fun on eToro and can be copied for free.
. I invest in my pension fund as a buy-and-hold.
The S&P shows this best with the trading range defined by the former 'bull flag'. Today's close left the index just below resistance. The lower close could suggest another run back to 2,590s.
The Nasdaq is also knocking on the door of resistance. Today's high at 7,128 tagged this resistance level which is also close to 20-day and 50-day MAs. There isn't much room for upside without generating a breakout - a breakout which would nicely set up a move back to 7,500. However, the least path of resistance is down but it will take more than a day's selling to break the trading range.
The Russell 2000 is also up against mini-resistance. I have redrawn a Consolidation triangle which looks a good upside target for the April mini-rally. There is a MACD trigger 'buy' which should help those using technical triggers.
Not much more to add. Tomorrow may offer more guidance.
You've now read my opinion, next read Douglas' blog.
I trade a small account on eToro, and invest using Ameritrade. If you would like to join me on eToro, register through the banner link and search for "fallond".
If you are new to spread betting, here is a guide on position size based on eToro's system.
---
Accepting KIVA gift certificates to help support the work on this blog. All certificates gifted are converted into loans for those who need the help more.
Follow Me on Twitter
Dr. Declan Fallon is a blogger who trades for fun on eToro and can be copied for free.
. I invest in my pension fund as a buy-and-hold.


