I will be keeping posts to a minimum until the New Year. Friday finished with a bit of a high volume flourish, which added a nice gloss to Thursday's big gains.
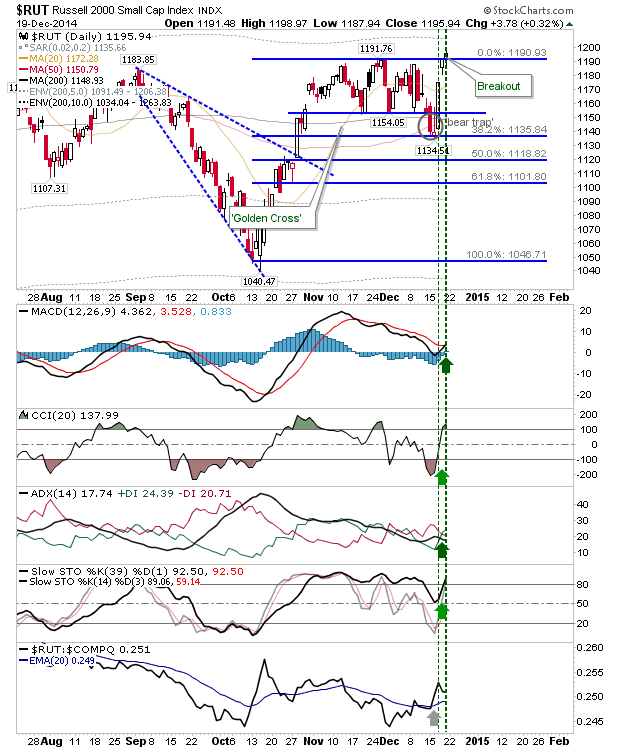
The Russell 2000 managed to go one step further with a breakout. Watch this index over the coming days; if it can hold the move it will bring other indices with it. The Russell 2000 has under-performed (relatively) all year, and if bulls are to maintain a broader market rally into a sixth year then the Russell 2000 will have to do most of the leg work. As an important side note, the Russell 2000 turned net bullish technically. The flip-side is to watch for a 'bull trap', but even here, this might instead widen the recent trading range handle as major resistance lives at 1,210/15 not at 1,190.
The Nasdaq finished with an indecisive 'spinning top,' candlestick. Shorts may like to take a look given the proximity to the last swing high. However, action in the Russell 2000 so far suggests a new high is favored, so don't be holding short-side if there is a decisive move higher. Junior traders are back in charge of trade desks, and low volume buying is all they are allowed do.
The S&P is in a similar predicament as the Nasdaq. Could copy and paste what was said for the Nasdaq, here too. Note, both S&P and Nasdaq did find support at Fib levels, so the October rally has had its bullish 'buy the dip' retracement.
On thing I hadn't mentioned earlier was how the Nasdaq Bullish Percents found support at prior trend resistance, following an earlier breakout. This could be an important intermediate term shift in favour of bulls, at least until this turns overbought again.
Also keep an eye on the Semiconductor Index. It has successfully back tested breakout resistance-turned-support, but it won't want to do so again. The next move should be above 704. Another move back to 660 sets up a much bigger move down, likely closing the measuring gap, and potentially challenging the 'island reversal' gap. The Nasdaq should take some of its lead from this index.
Finally, Nasdaq breadth is caught a little in no-mans land. We have the breakout in the Nasdaq Bullish Percents (Good), but we also have a potential 'bull trap' in the Nasdaq Bullish Percents (Bad), and a decidedly neutral Percentage of Nasdaq Stocks above 50-day and 200-day MAs. Some could argue the bearish divergences in the latter metrics will lead to a big wash out (as fewer stocks are available to support the rally), but this has been going on sine the end of 2013, and nothing has come out of it yet...
So, for the rest of the year, watch the Russell 2000 breakout and Semiconductor Index for potential leads in the Nasdaq. The S&P will likely follow suit. The New Year will probably bring the sellers back, but this may be the Monday (not the Friday), when this happens.
Happy Holiday!
---
Accepting KIVA gift certificates to help support the work on this blog. All certificates gifted are
converted into loans for those who need the help more.
Follow Me on Twitter
Dr. Declan Fallon is the Senior Market Technician and Community Director for
Zignals.com, and Product Development Manager for
ActivateClients.com. You can read what others are saying about Zignals on
Investimonials.com.
JOIN ZIGNALS TODAY - IT'S FREE!