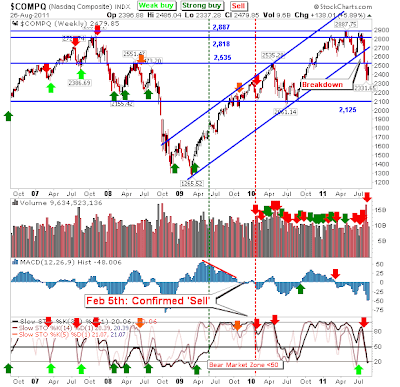
Markets are caught in an unusual state. From the perspective of breadth they are still oversold, but on a support/resistance basis they are caught in a bit of a no-mans land (with the exception of the Nasdaq 100).
The Nasdaq is oversold technically but not close to a weekly support zone to make it attractive to long term buyers, despite the defense of an early August swing low on the daily time frame. Weekly buying volume was light and below prior weekly selling.
The Nasdaq 100 is best positioned to lead markets higher. A thick band of support runs from 2,130 up to 2,217, as marked by 2007 reaction highs. The index isn't yet oversold but it wouldn't take much selling to push it there.
Where bulls hold the cards on the weekly time frame is in market breadth. Nasdaq Bullish Percents were little changed on the week but are well within market bottom territory. Even if a market bottom is not in play it's likely not far away (at least a decent trading low).
The Percentage of Nasdaq Stocks above the 50-day MA remains below 10% for a third week in a row. Last time it traded below 10% was in October 2008 and a major reaction low emerged soon after.
The Russell 2000 was one of the indices smack bang in the middle of weekly support and resistance. Stochastics [39,1] are oversold and this is usually enough to mark a decent bottom.
Likewise, the S&P sits in a similar predicament, although its broader underperformance is a larger concern. It remains a long way from challenging 2007 highs. However, stochastics [39,1] are oversold.
The big plus for the S&P is the Percentage of S&P Stocks above the 50-day MA made an all-time low. It only climbed above the 10% mark this week. So while the S&P may be caught between support and resistance, the breadth indicator is firmly in bottom territory.
While recent market focus has been on the daily time frame, the weekly timeframe offers its own guide. While it's hard to see obvious support on this longer time frame, market breadth is screaming a bottom. The caveat for market breadth bottoms is the bottom in the parent index typically occurs on a positive divergence in market breadth (i.e. a higher market breadth low on a lower market low).
Keep an eye out for breakout opportunities as the market bottom builds out, positive divergence or not...
Follow Me on Twitter
Dr. Declan Fallon is the Senior Market Technician and Community Director for
Zignals.com. I offer a range of stock
trading strategies for global markets which can be Previewed for Free with delayed trade signals. You can also view the top-10 best trading strategies for the US, UK, Europe and Rest-of-the-World in the
Zignals Trading Strategy Leaderboard. The Leaderboard also supports advanced search capability so you can tailor your strategies to suit your individual requirements.
Zignals offers a full suite of FREE financial services including price and fundamental
stock alerts,
stock charts for Indian, Australian, Frankfurt, Euronext, UK, Ireland and Canadian stocks, tabbed
stock quote watchlists, multi-currency
portfolio manager, active
stock screener with fundamental trading strategy support and
trading system builder. Forex, precious metal and energy commodities too. Build your own
trading system and sell your
trading strategy in our MarketPlace to earn real cash.
You can read what others are saying about Zignals on
Investimonials.com.
JOIN US TODAY - IT'S FREE!


