Friday was a rough day for the markets and left the mini-rally in tatters. What had Stockcharters to say about it?
Richard Lehman of the
Channelist.com kicks off with channel breaks:
7/18 -- Short term blue minis all broke Friday and long term declining purples held. The long term trend wins, and right now the direction is quite clear. The new red minis that began Friday cannot all be drawn yet, but the breaks and the direction are indisputable.
The ultimate downside target on the long term purple channels could be 8-10% down from here, but lets see how it plays out before we bet the farm on short positions. Earnings reports are still liklely to cause volatility in the next few weeks.
7/15 -- A number of short term minichannels have now changed slope but are still trying to climb, so I've drawn them as larger green channels now. Volatility dropped sharply when the breaks did not follow through to the downside. The dollar keeps dropping, but Toronto stocks sure had a nice day. Things are getting a little jumbled ahead of tomorrow's option expiration. The long term charts are still pushing up against the purples but encountering resistance.
7/14 -- Momentum is waning, though none of the short term minichannels have broken. The Dow and SPX actually touched their lower blue mini lines, and held so far. It looks as if the long term declining purple trendlines are having an impact here, and at the least, we may see slope changes to someting flatter if not breaks soon.
Yong Pan of
Cobrasmarketview is keeping to a nearly neutral market stasis.
Validation for a top?
Bear trendline resistance too
Ten-year yield break and backtest (lower yields ahead....)
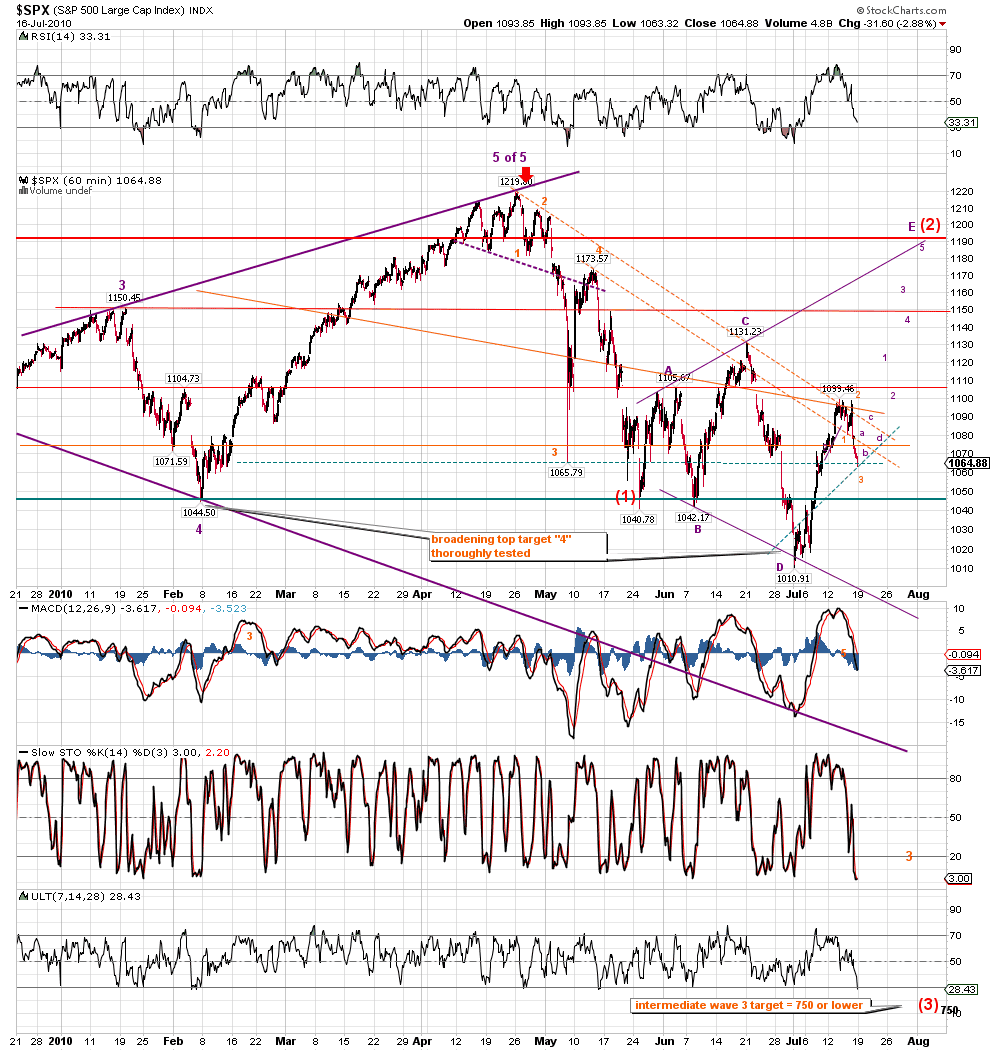
Michael Eckert of
EWTrendsandcharts has the bearish wave count playing to form with the trendline backtest and the potential downward target of 878 for the S&P (closed Friday at 1,065)
The 60-min chart showing a clearly defined downtrend
Slightly different take on the Elliot-Wave count by
Anthony Allyn of
Tonyspublicchartsblog.
Joe Reed summarises how bad Friday was
While not marked on this chart last week was a clear bear flag for the Gold and Silver Index (note bull trap on WM %R too)
Finally,
Robert New shows the rejection of resistance in the Nasdaq too:
Ducks all aligned for a nasty week this week? Last week highs also mark declining resistance from April - so if they break it will be a significant victory for bulls.
Follow Me on Twitter
Build a Trading Strategy Business in Zignals
Dr. Declan Fallon, Senior Market Technician for
Zignals.com, offers a range of stock
trading strategies for global markets, also available through the latest rich internet application for finance, the
Zignals MarketPortal or the Zignals
Trading Strategy MarketPlace.
Zignals offers a full suite of financial services including price and fundamental
stock alerts,
stock charts for Indian, Australian, Frankfurt, Euronext, UK, Ireland and Canadian stocks, tabbed
stock quote watchlists, multi-currency
portfolio manager, active
stock screener with fundamental trading strategy support and
trading system builder. Forex, precious metal and energy commodities too.
Build your own
trading system and sell your
trading strategy in our MarketPlace to earn real cash. Read what others are saying about Zignals on
Investimonials.com.
JOIN US TODAY - IT'S FREE!