This week sees September roll in, with Labor day weekend to finish it off. Will the arrival of September see the end of the summer rally? Do the Stockcharters have anything to say about it.
Anthony V Caldaro of
Objectiveelliotwave.com has labeled a 'B' wave top of the 'ABC' correction; is this for the minor correction or is it *the* "B" wave top?
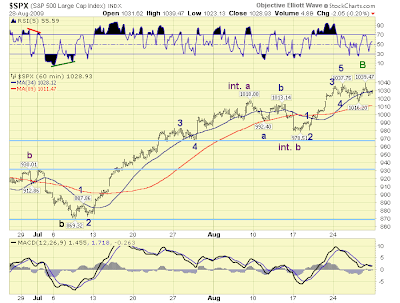 Looks like a minor 'B' top based on the weekly chart. I don't know if the second light blue line (c1,050) is the target for the final "B" wave?

Plenty of downside room for the Dow but that index has already taken a beating (and a significant reshuffling) over the past year.

Yong Pan of Cobrasmarketview lists dominant bullish signals on the intermediate time frame and a mixed bag on the short.

Yong Pan's market top conditions; 3 out of 4 met (same as last week):

Fast approaching the vacuum of 1,050 to 1,225 - could see a sharp move up as a final blowoff. What does this do for the EWT 'B' wave? Not sure...

Confirmed 'Buy' signals hold (and still someway from a 'Sell')

Richard Lehman talks Prechter top
8/29 -- I received a number of comments on my Prechter remark, so let me clarify why I made it. Bob Prechter is an astute and widely followed market technician and behavioralist who has made a number of notable market calls using Elliott Wave Analysis over the last 30 years. (Because he is such a well known market technician, Bloomberg sent him an advance copy of my upcoming book and he gave some very positive comments.) I do not adhere strictly to Elliott wave analysis, but I do find it a valuable tool in the technical arsenal. I think it worthy of note that Prechter is making a major sell call here as he has made some major calls of this nature before (many in stark contrast to the prevailing opinions) and been right. He also made a call like this in the late 1990s and was wrong for almost two years as the market kept rising.
From my perspective, the long term channels are extended on the upside and could certainly be subject to a respectable sell-off this fall, but there is nothing to say that process has begun yet. An advantage of the channels over E-waves is that we will see any new trends very early in their making. Besides, Prechter is not looking for a crash downward -- he is looking for a very long multi-year decline to unfold from this level, which will offer many opportunities to get in if it becomes reality. We will see those opportunities very clearly on the short term trend channels. For the record, VIX futures are still carrying heavy premiums for Sep and Oct (bearish) and TrimTabs Research was quoted yesterday as saying that Insider selling relative to buying is at more than 30-1 ratio -- a sign that would also support a case for an interim peak of some kind soon.
So, we are in green upchannels on most indexes, and the seasonal trends tend to be relatively positive for the week before labor day. Given the factors above, any further rise might be a good place to lighten up on long equity exposure, but a short position is not yet indicated by the channels at the current moment.
Joe Reed has had an active storm track of late

Fib retracements on the move once more now that the 38.2% retracement has been breached for small and large caps

Volatility complacenent (and menacing)

Finally, Ahsan Haque of TheSmartTraders has listed pivot and supports for the S&P

plus additional briefing data for next week:

Lots of skepticism but no clear 'Sell' - nothing new in this...
Dr. Declan Fallon, Senior Market Technician, Zignals.com the free stock alerts, stock charts, watchlist, multi-currency portfolio manager and strategy builder website. Forex data available too.


