A relatively respectable close to the week after Monday's horrors, how did the Stockchart.com folks see it?
Yong Pan's S&P and breadth watch has seen nascent bearish signals turn neutral/bullish. But he is waiting for the rangebound action to break before getting too confident.
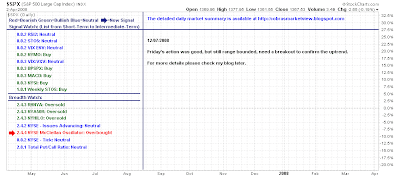 His charts show technicals in a more neutral position; could go either way:

His observation on action following the November bottom is bullish:

Breadth indicator buy signals matched with bullish divergences in those indicators and a bullish wedge breakout:

Maurice Walker saw Friday as a gunfight between bulls and bears.
The bulls have take bold action and aggressively pushed prices above the intermediate downtrend, causing the inverse head shoulders pattern to garner support, which means that it has a strong chance to flourish and play out. The bulls took a leap of faith across the trendline, not allowing the bears to chip away at this rally any further, and sent them packing to get out of town before sundown. Well, they got out of Dodge alright, but they went out in a blaze of glory, dragging the market way off the all time highs of October of 2007. But now they are wanted dead or alive by the bulls, who will either take them prisoner or shoot them on the spot.
He has gone for a 'buy' in the S&P:

His 60-min charts mark in the reversal head-and-shoulder pattern:

Agree with his assessment on the daily charts:
Well, a trend is a trend until it isn't, and most of these trendlines are being taken out, with exception to the Dow. The SPX, NASDAQ, QQQQ, Russell 2000, all broke their downtrends today on mediocre volume. The breakouts are not decisive. We still need to see a follow-through with expanding volume in order to confirm the breakouts. However, the DJIA didn't breakout, stalling after it slammed into the intermediate trendline. I do expect the Dow to follow suit.
When a trendline breaks, prices will either retrace rapidly or consolidate forming a reversal pattern. In this case the latter is likely true, with an inverse head and shoulders pattern slowily being carved out on the daily charts.
With the breakouts on the daily charts, and the head and shoulders patterns successfully holding up on the hourly charts, I am once again playing the long side. Furthermore, the 5-day EMA touched the 20-day SMA in a bullish double crossover kiss. This is extremely encouraging, I didn't think it would come until early next week. Now let's see if the 10-day EMA can cross above the 20-day EMA. The Aroon down on the S&P 500 daily chart (pg 4) is now moving below 70 again, moving in concert with the Aroon up. Thus, confirming that prices are in fact trendless for the moment.
Richard Lehman's charts worked a treat this week. His Dow 5-min chart below:

12/5 -- Patience paid off as the Dow came right down to the green upchannel, took its magic turn, and gave us a 500 point bounce. SPX followed suit. In order for the large caps to come down to the green lines, the small caps had to exceed their green lines, which simply pushed their greens to flatter slopes but still heading upward. The bounce cleared the red mini as well, which is a confirming action.
The short term charts now have more room on the upside, though don't expect it to continue at the pace of 500 points in a couple of hours. Don't even be surprised with one or more 100-300 point pullbacks in there somewhere either. The important point now is that a number of the one-year charts are again sitting on the upper lines of the downchannels from last year. Those one-year lines have held back all rallies thus far, but the pullbacks have been getting shorter each time and this now looks promising for a break upward this month, even though I would expect that to result in more of a slope change on the one-year downchannels than any kind of 'V' bottom anytime soon.
12/4 -- Today's nasty surprise caused me to backpedal to the original green channel in most cases when the more bullish blue alternate was broken. There is also a red mini showing up inside that channel which may or may not be finished on the downside. On the whole, the short term bullish case was damaged today, but not ruined. The direction is still up, and even if the red mini extends further, it may still then turn up.
12/3 -- The upchannels continue and there are now two alternative slopes to many of them. Both are shown here, but I've drawn in the more bullish in several cases because it appears to be the way things are leaning. If we continue up in the short term, we may break the downtrend lines from last year that have held back every advance thus far. Be ready for that possibility as it could take us up to 9000-9200 fairly quickly.
Dr. Joe has his weekly watch up - doesn't see Friday's gains as bullish.

Handy Nugget from Joe on why the January effect is so important:
The reason is... Millions of Retirement Plans are funded in Jan, so you can get an idea of where the money is going. Are investors buying stocks, or is money going into bonds and other investment vehicles?

Retail index finding some footing:

With Ted Burge's support/resistance lines the 50-day MA is looking good for a short term upside target:

Overall - things are looking a lot better...
Dr. Declan Fallon, Senior Market Technician, Zignals.com the free stock alerts, market alerts and stock charts website


