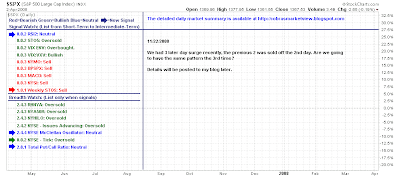
Friday's bright finish couldn't undo another depressing weak for the averages. How did the Stockchart.com ers see it.
Yong Pan has seen a broadening of the 'sell' triggers in the S&P with a couple of breadth indicators shifting to neutral from their prior bullishness.
 Once again, there is another 'bottom' signal - but we have seen similar ones of these fail in the past. It looks like a significant bullish divergence to the early October bottom but will it play like one? This would mean a sharp rally past 1,000 (seems highly unlikely under the circumstances):

Yong Pan draws the line in the sand for the short term:

No shortage of bullish divergences in the charts - but only have to look at July to see what can happen when they don't play out:

Maurice Walker open with FDR's quote on fear and makes fear the focus of his weekend commentary. His lead charts show the fear all too well:

I don't believe in his thesis of people selling because of fear of higher taxes in 2009; I think people are selling becaue of fear about their jobs. If you don't have a job you don't care what the taxes are...
However, Maurice has a good close up of a three-black-crow pattern in the weekly Dow Jones chart. As he says, this is a long term bearish signal.

I agree with Maurice here:
Yes the force of fear can do amazing things, but is also the stuff that millionaires are made of. Yep, more millionaires are created during an economic down turn than other times in history. And mark my words, in 5 years from now we will be saying, remember when Citigroup and GM were 3 bucks a share. I believe that Warren Buffet is correct, by doubling down on the long side for long term positions. Buffet, who is no fool, has openly stated that he thinks investors ought to be buying not selling. I believe that this bear market is a mechanism that many folks will use to build long term wealth, and that we will witness a whole new crop of multi-millionaires that sprang up during this economic upheaval.
His comments on inflation:
The Inflation Front
We got the consumer price index (CPI) data this week for October. It had the largest retreat in US history dropping 1 % for the month. Think about that for a moment, if that percentage were annualized, it would be 12 % a year. That is staggering. An inflation has peak as I anticipated it would. Every component that makes up the CPI data is in single digits except for energy, which will likely arrive there sooner or later as crude oil futures close below 50 dollars a barrel for the first time since May of 2005. Crude oil is slightly below the January 2007 intraday low of $51.03.
With CPI on the decline, it means that we are in a deflation period right now, while the bigger picture is one disinflationary.
Now with our descending triangles we still run the risk of further downside. But there are those of us who are accumulating certain stocks for the long term may be holding a gold mine.
I went short on the ultrashorts last week for 2 sessions getting a 9 % return. The ultrashorts had a 20 % swing higher from the intraday low on Thursday to the intraday high on Friday, hopefully some of you caught some of it. I close the positions when the doulbe tops on the 15-minute charts were forming and moved to cash. I may jump back in Monday or Tuesday, when a diriectional move has been decided between the descending triangles and the complex inverse H & S patters
He has a lengthy technical summary on his Stockcharts page, but you can get a video of his on his website, thechartpatterntrader.com
Joe shows the week that was:

And the weekly tests of 2002 lows:

But take a look at the retail index: crashed through 2002 support:

But Gold Index is doing well at 2005 support:

Ted Burge shows Ted Line support for the GLD:

Positive test of support in the Russell 2000, but look at the gaps between support and resistance:

Finally, Richard Lehman remains pessimistic on a bottom:
11/23 -- Despite being conspicuously announced at 3 pm on an expiration Friday, I hope you don't really believe that Geithner being named Treasury Secretary actually caused a 500-point rally. That's simply the media trying to act like they really know what drives the markets. This was a snap-back rally caused by the market's extending itself on the downside as evidenced by the touching of channel boundaries across numerous indexes. The channels tell us when the trends have hit extremes and are likely to reverse. That's why I told you on Thursday to be ready for a snap-back bounce.
Short term channel lines were hit on Thursday. Many were dead-on hits, though selling was strong enough to drive a couple of indexes down slightly below the channel lines before bouncing back. Other than that, lines were hit all over the place and in ALL time frames. There was a beautiful hit to the Dow's three-year support and the QQQQ hit its support line in all three time frames.
That doesn't necessarily mean we have a bottom, of course. In fact, I find that unlikely. If we continue up at all this week, we will hit the short term downtrend lines fairly quickly. They will represent the first test, and will tell us whether the downchannels will continue or whether a reversal of larger proportion might possibly be in the making. Seasonal factors may be positive, but generational factors are far more powerful right now, and are clearly down.
I don't have to tell you -- these are unprecedented times. Its impressive how well the channels are still working compared to other methods of valuing stocks and determining trend direction. The old paradigms of valuations, volatility and holding through thick and thin are crumbling (along with the heart and soul of corporate America). A new paradigm will have to emerge from this catastrophe.
Personally, I do not yet believe the market has overreacted enough to justify this being a final bottom. I say that because I see the fundamentals still cascading down.
Dr. Declan Fallon, Senior Market Technician, Zignals.com the free stock alerts, market alerts and stock charts website


