Another week for the Stockcharters to take a look at the market.
Richard Crockett has taken a (very) similar route to me on the bullish percents:
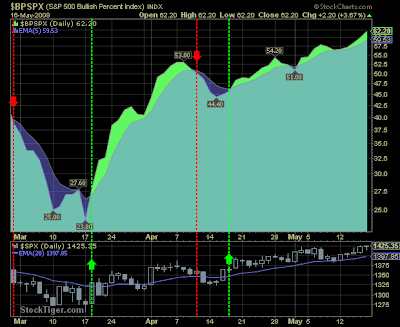
But does have a nice bull/bear chart for the S&P:

Dr. Joe remains bullish on Agriculture:
The US Dept of AGRICULTURE reported the 'Corn Harvest' is 7% lower than last year. They estimate the price of corn will go up another 30% this year. The cost of 'Feed' has already increased so much that farmers have cut back production of chickens and pigs. Basically this means the vast corn-chicken-pig related food products will keep going higher. Agriculture remains bullish.
Joe gets his ConocoPhillips (COP) breakout, will Exxon Mobil Corp (XOM) be next?

Ribbons on the rise (bullish):

The Maurice homily - he is edging towards short positions, but advises caution:
This market continues to hold up, despite recent selling pressures at resistance. The S&P 500 and the SPY broke out of inverse head and shoulders pattern today on the 10-minute chart, but the pattern needs a follow through to have any substance. Prices are still hovering around the 142 area on the SPY. The pattern measures approximate 3.50 points with a target of 145.50.
I attempted a short at resistance yesterday and got stopped out today with a slight loss. The important of having a tight stop at these levels goes without saying. However, I wasn't stopped out of my short on the Qs, but I am maintaining a tight stop on it.
The Qs 10-minute chart broke out of an ascending trinagle yesterday, and backtested the move. If prices close above 50, the patterns target measures to 51.15, which will likely be reached.
If the Nasdaq and the S&P 500 can move above this area of resistance, they have a good chance of tagging the 61.8 Fibonacci retracement off the October highs.
But until the rising trendline on the S&P 500 is violated the bulls remain in power. We still have a rising wedge on the daily chart, which could allow a corrective move to take place. Meanwhile, the VIX is still at levels of support which causes me to be short term causious at these levels. If the current rising trend does hold up and we break to knew highs, then the it will be reclassified as an intermediate trendline rather than a minor trendline.
Currently the S&P 500 is stuck in a trading rance between the 1423 and 1383 area. Which ever way gets a clear breakout, will be the direction for a while. If we break above 1423, the bulls will continue to dominate, and if we break below 1383 then we will have a lower low in place. But with the breakouts on the 10-minute charts there is no reason to think that the bull can't take prices to the 61.8 fibonacci retracements.
If the S&P 500 reverses at this level, we may be seeing a doulbe top pattern being carved out at the 1424 area. If prices break below the confirmation line of 1383, then the pattern measures 41 points with a target of 1341. That is the a 50 % retracement from the March low, and it is right where prices would touch if a speculative paralell trendline were drawn from rising resistance (see the 1st chart down). but respect the bulls because we could go higher before we go lower.
thechartpatterntrader.com
Not sure I go with his double top pattern - but it's worth seeing:

His 10-min S&P chart would suggest otherwise:

Volatility looks ready to pop (higher):

Ted has the S&P ATR Point-n-Figure chart' breakout and target of 1,439.62; will this be the point of reversal?

Yong Pan has more red on his weekly summary (another VixandMore reader):

He is looking at Friday's black candlestick in the SPYs to signal a reverse:

Finally, Richard Lehman is finding it hard to be bearish; fundamentals say one thing - charts another...
5/17 -- Its easy to be bearish, given fundamentals, but tough based on the charts. Most of the indexes except for the Naz have broken upward on the daily long term charts (saying the decline from last September is history). All the hourlies are still heading up in long, well-defined channels. And the short terms are all positive. Oil continues up (though just hit its upper line on the hourly) and gold's heading back up. VIX is collapsing. We should all have been long the Toronto index as well! Toppy as things are, nothing has broken.
5/15 -- This rally really has surprising legs. The Dow reversed from what looked like a break and came all the way up to its larger channel line on the ST charts. Given that the SPX and others already exceeded that line on their respective charts, the Dow may actually be the laggard. Mini uptrends are extending or changing slope but still heading up. Things are definitely toppy, but VIX has collapsed and we are breaking through the long term downtrend lines from last September.
5/14 -- Today's rally and abrupt fall had the earmarks of a market that hit its limit for the moment. The rally of the last 3-4 days was narrow and steep, indicating a leg of something larger anyway, rather than a sustainable new upchannel. So, the late-day decline actually broke several of these minis (Naz, RUT and SPX) to the downside. The SPX actually has some good channel lines that show how this leg may have just peaked.
5/13 -- Neither the Dow nor the SPX have effectively broken their ST mini downtrends yet, though they have thus far bounced twice off the green uptrend lines (on the hourlies). The rally 'feels' tired to me, at least with the large caps. I can't help but notice that while things continue to creep upward over the past several weeks, there is now more vulnerability downward than upward. Nonetheless, nothing's broke till its broke, as Yogi would say.

Declan Fallon is developing trading strategies, market indicators and sentiment tools for Zignals


