Posts

Bullish Engulfing Patterns - But Volume Light

Image
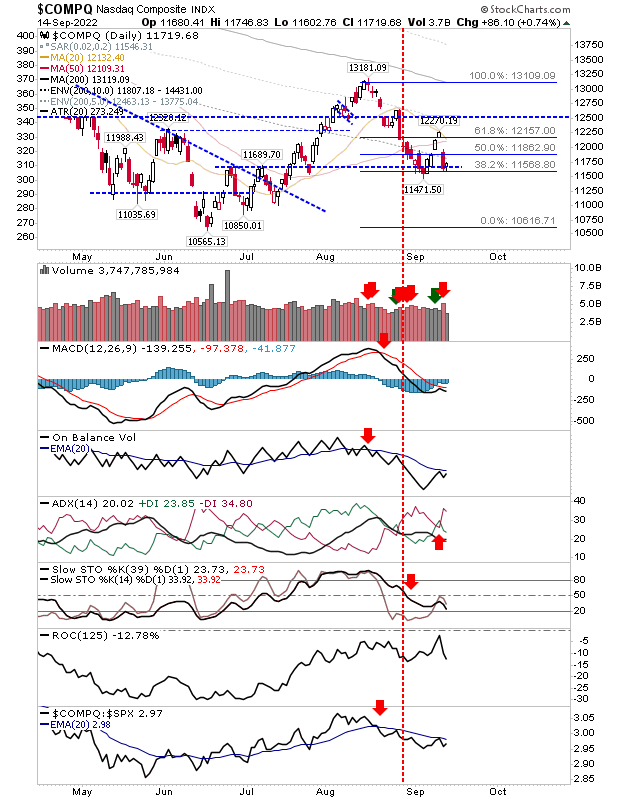
If today's buying volume was greater it would have been considered a good day; instead, it's a day with potential but still needs more from buyers to convince.  On the positive side, bullish engulfing patterns like today's are reliable reversal patterns, and traders could use them as buying opportunities with a stop below the low of the pattern (exit on a close below rather than an intraday violation). How much upside to look for will be contingent on the amount of buying volume we see over the coming days, but closing the gap down in early September following the 4-day sequence of gains would be a good start as an initial target. In the case of the Nasdaq, we didn't see a whole lot of technical improvement, neither was there much in the way of relative performance gains to peer indices. So, at the moment it's a pure price play trading just above support.

Bulls last chance to bounce the decline

Image
Markets are running out of opportunities to stall the decline from August's swing highs.  Friday's options expiration will have clouded the volume picture, so we don't necessarily have a clear capitulation but there could be some cause for optimism. Indices have gone beyond the standard Fibonacci retracement and there isn't a whole lot of room for bulls to come in without a full retracement of the rally to become the most likely outcome to emerge here. The Nasdaq closed with a gap down bullish 'hammer', which leaves it open for a gap higher and potential bullish morning star set up; but for that to happen we have to start with a opening gap higher and there can't be a close below Friday's open (and ideally, no intraday violation of Friday's low).  Technicals are oversold, which does favor some form of bounce - but such a bounce is not necessarily one to start a new long term rally - as a trader, we can only use the information we have.  If looking to

Sellers wipe four days of gains in one go on higher volume distribution

Image
Forget about today's non-action, the damage was done yesterday on a significant escalation in volume. Today was just a pause in that selling. Optimists might see today as a bullish harami, but in the absence of an oversold condition (momentum technicals) I would discount this.  Expectations are for a move back to June lows - and possibly new lows - but should this happen then we would likely see a significant bullish divergence in breadth metrics.  It would yet be another major buying opportunity for investors, but let's see what the next few days bring.  The Nasdaq is back at the 62% retracement (38.2% on the chart) for a second time.  I wouldn't expect this second test to be successful, but for now - that is what it's doing. Today's buying volume was well down on yesterday's selling and technicals remain firmly bearish.

Four straight days of gains on falling volume

Image
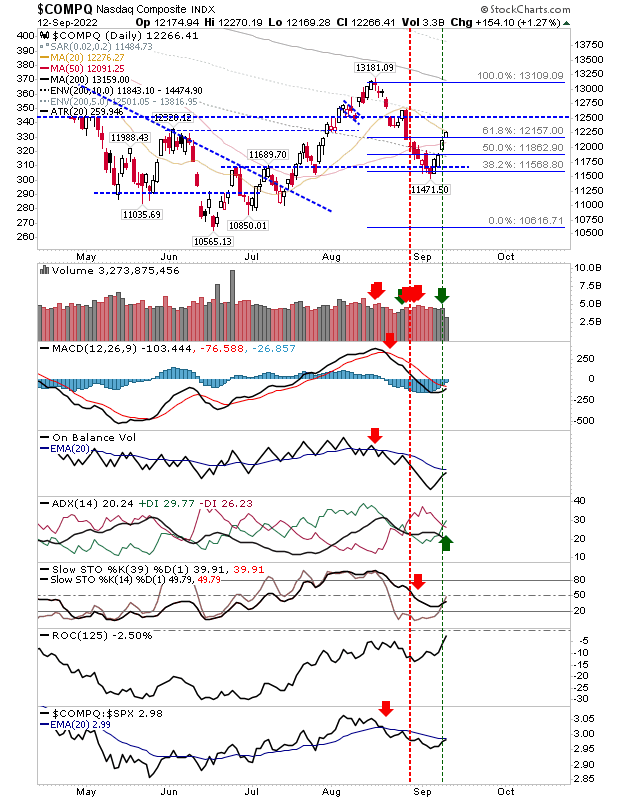
This bounce has gone through 50-day MAs and is now challenging 20-day MAs for the S&P, Nasdaq and Russell 2000.  Since the swing low was established last week indices have rallied without pause.  At this stage, we would want to see how markets react to when sellers return.  For the early part of the day it looked like we were going to get that mini-top reversal candlestick, but instead, all indices were able to close at highs.  Gains in the Nasdaq were enough to see a 'buy' trigger in the ADX, although there is still need for a few more days of gains before technicals turn net positive - something we may not see.  The index is also underperforming relative to the S&P, but is close to a signal crossover in this regard (towards outperformance). 

Archive

Show more