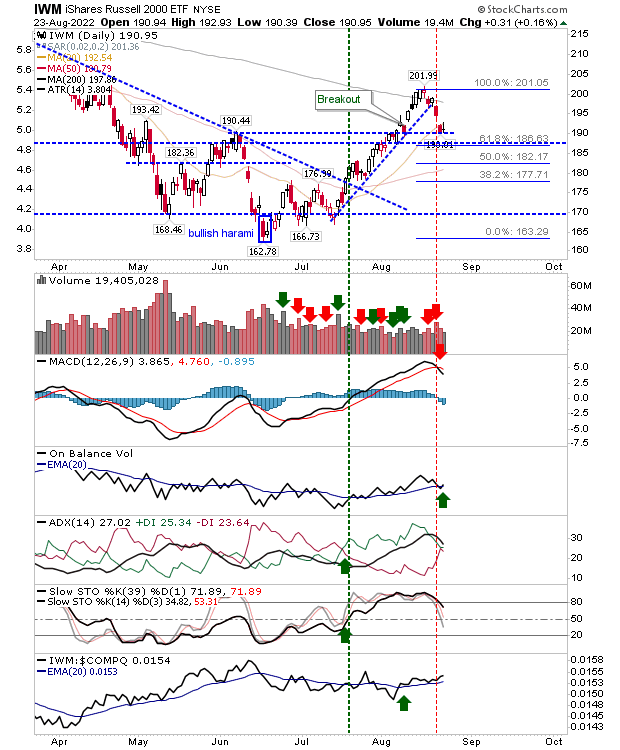
Posts

Early Risers

Image
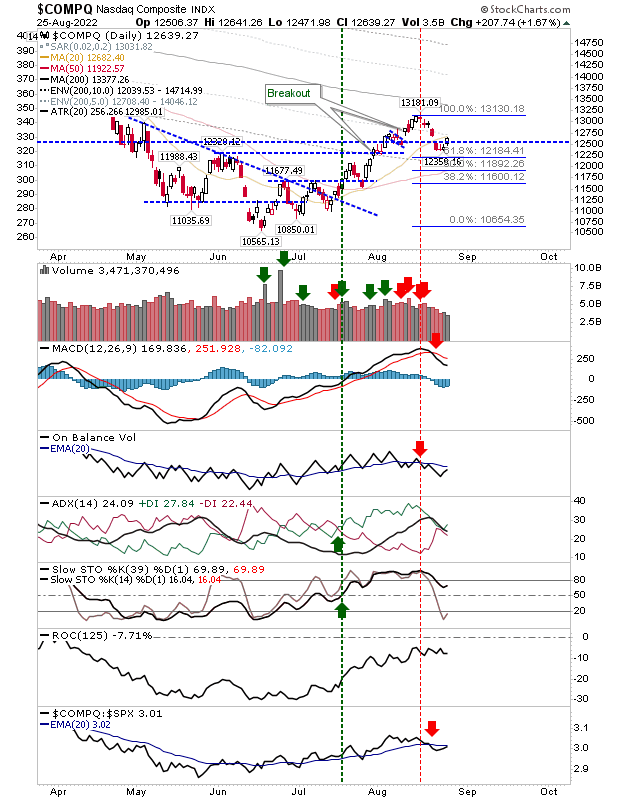
Buyers stepped in to give markets a boost with the S&P going as far as to register an accumulation day.  Today's gains still feel a little early in the game but whatever the cause, the move higher can't be ignored.  This may be part of an a-b-c style, zig-zag move into Fibonacci retracements but much depends on what happens when indices make their second test of 200-day MAs.  The Nasdaq had the biggest gain on the day, but the buying wasn't enough to register an accumulation day and it didn't quite recover its 20-day MA. Aggressive shorts may look to target the 20-day MA but a move back to 13,181 can't be discounted as part of this mini-rally; so keep stops tight if using the 20-day MA for entry.  Note, today's gain did little to recover the 'sell' triggers in the MACD and On-Balance-Volume. 

Markets stalling near 20-day MAs

Image
Sellers have near term control of indices with 20-day MAs currently under test. Markets closed today on neutral doji - which gives chance for bulls to put in a low, but a larger pullback would be preferable to firm the strength of June lows.  On the bullish side, the setup over the last two days can be considered as bullish-harami-doji - one of the more reliable bullish reversal patterns; a gap higher tomorrow could see a test of August highs before markets reach their next decision point.  The Russell 2000 is the leading index by relative performance to its peers. However, it's working off a 'sell' in its MACD despite recovering from a 'sell' in On-Balance-Volume.  If there is an index to lead a bounce tomorrow, then look to the Russell 2000 to get the party going.  As an added kicker, it's holding on to June swing highs as support. 

Friday's selling to evolve into support tests with Fibonacci

Image
Bears got more out of Friday to the extent we may get the larger pullback I'm looking for.  We saw something similar in late July that didn't evolve into a larger test of June lows, but now we can look at retracements that could play into Fibonacci retracements.  With Fibonacci retracments we can look at confluence with other support zones - which increases the probability of those price levels playing *as* support.  The Russell 2000 is the index leader.  With Fibonacci layered over the move off June lows the 50-day MA is looking like a natural support test.  This will hurt the current net bullish technical picture, but it should be better for the index in the long run.

Second Day Indecision

Image
We had a rare scenario when the #sectorbreadth analysis for the S&P touched the 90% territory of overboughtness. Not surprising, today's action started to see some easing off highs, although today's set of candlesticks has more in common with a neutral set up - so bulls are reluctant to give up this rally. The lead index - the Russell 2000 - after pushing above its 200-day MA earlier in the week, sellers had managed to push the index back below its 200-day MA.  Despite this loss, technicals remained net bullish. 

Archive

Show more