Posts

Markets attempt to rally but fall short by the close

Image
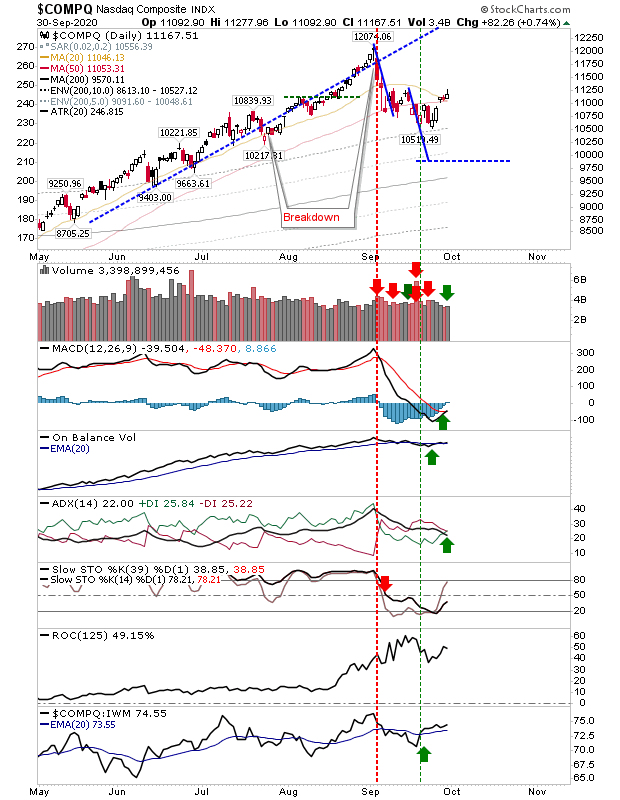
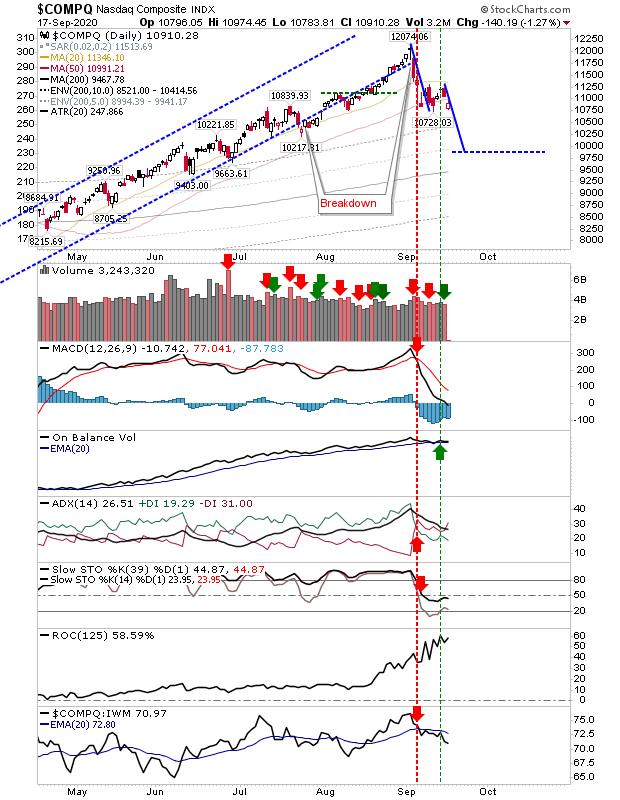
It was looking good for the indices in early m the day, but by the close indices weren't able to hold on to their gains. However, all indices finished in positive territory and any (small) upside tomorrow would likely be sufficient to maintain momentum. The Nasdaq closed today with a 'buy' trigger in the MACD and ADX, along with a 'buy' trigger in On-Balance-Volume.The Nasdaq is outperforming the Russell 2000 and while it has enjoyed just over a week's worth of gains it has so far resisted the initial move to the measured target. 

Bounce stalls despite morning gaps

Image
Friday's rally offered a promising open with a gap higher, but there was no follow through on these gains.  In the case of the Nasdaq, there was a close above the 50-day which also picked up the 20-day MA but if the gap is to register as a true 'breakout gap' it cannot close. There was  a 'buy' trigger in OBV to go with today's gain. The index is still outperforming Small Caps as it looks to build on its leadership role as the primary home for funds. 

S&P Bounces At Measured Move Target

Image
An easy headline which has played out as true, although the same bounce occurred in the Nasdaq well before the measured move target is reached. In the case of the S&P, the measured move target is above the 200-day MA - a typical support level and a more likely area for a bounce - so it remains to be seen if this bounce will hold but it does provide a level to set protective stops (for existing positions in the S&P and member stocks). Note, technicals are all net negative and aren't really in support of a bounce, with the exception of short term and intermediate stochastics which have converged at an oversold state. 

Selling Accelerates; Measured Move Targets Still In Play

Image
Sellers again stamped their authority on markets with significant pushes lower which completely erased the weak buying of Tuesday. Markets remain on course to reach their measured move targets.  The index closest to doing so is the S&P.  No surprise to see technicals for the S&P net negative although the index continues to outperform speculative Small Cap stocks. Volume climbed to register distribution, an additional confirmation for today's selling. Once the measured move target is reached - likely tomorrow - next up will be the 200-day MA.

Selling Continues Across Indices

Image
Indices continued to decline with measured move targets for the S&P and Nasdaq still in play. However, the real damage was done in the Russell 2000. The index made a clean break below its 50-day MA on a gap down with new 'sell' triggers in Stochastics, ADX and relative performance. Volume climbed to register as distribution.  The index which had been defending the breakout is now having to contend with a new level of overhead supply.

Measured Moves Down In Play for S&P and Nasdaq

Image
Friday's selling sees a break in the 50-day MA for the S&P, following the lead of the Nasdaq from last week. Selling volume climbed in confirmed distribution across the indices. The measured move targets for both these indices remain in play with each swing low likely to breached Monday. Not surprisingly, technicals for the S&P and Nasdaq are both net bearish.

S&P and Nasdaq Move Towards ABC Correction

Image
Indices gapped lower in what's evolving into an ABC style correction; in essence, a zig-zag move lower with a projected target of the measured move of the initial decline. For the S&P, today's selling also registered as distirbution. The Nasdaq has a measured move target of 10,000. Technicals are mostly negative with On-Balance-Volume clinging on to its 'buy' trigger. Today's selling also undercut the 50-day MA with a gap lower. Buyers are unlikely to step in now, so until the index reaches a level attractive to buyers (hence the likelihood of an ABC correction) I will be looking for lower prices.

Archive

Show more