Posts

Weekly Market Commentary: Small Caps Breakout

Image
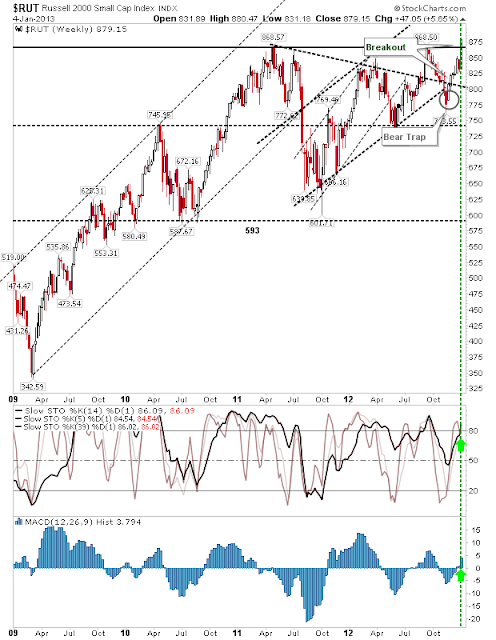
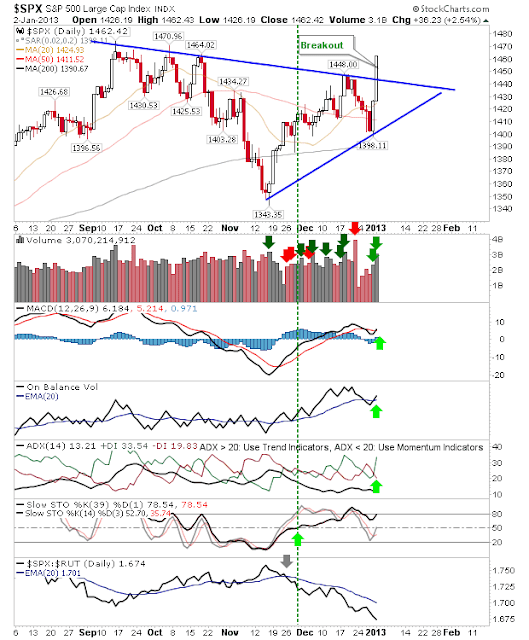
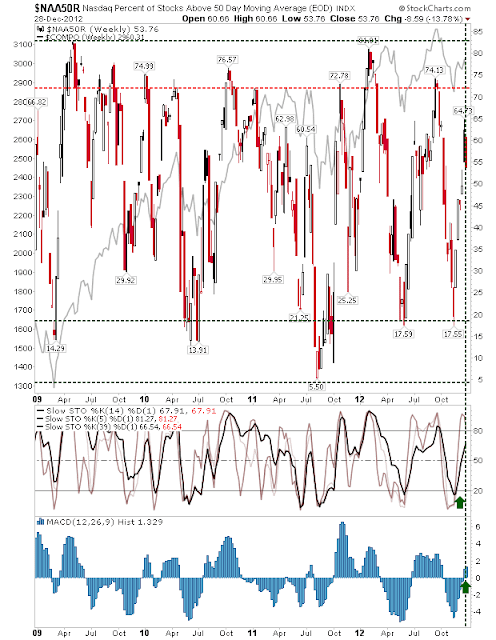
It was a good week for the indices, with the fiscal cliff nonsense resolving in bulls favor. The Russell 2000 was the star of the week as it made new multi-year highs. It handily cleared resistance on a net bullish turn in technicals. Bulls will want 868 to hold as end-of-week support if this is a valid breakout. The Percentage of Nasdaq Stocks above 50-day MA is in overbought territory, although this rarely signals an absolute top, it does suggest those looking to buy are best to wait for the next pull back. Technically, this breadth metric turned net bullish. The Nasdaq Bullish Percents also finished the week net bullish (in technicals).  However, it is someway from overbought territory, which bodes well for a continuation of this rally (with the Percentage of Nasdaq Stocks above the 50-day MA marking a temporary swing high of a larger move). It was the same for the Nasdaq Summation Index, which is neither overbought directly, or technically. Again,  this favors furthe

Daily Market Commentary: Light Trading Action

Image
Bulls can be satisfied with yesterday's action. Markets were able to hold their big gains and what selling there was, turned out to be very light. The S&P did see a technical change with an On-Balance-Volume 'sell', and after a recent upswing in buying, it will be important this doesn't morph into a new downward trend. The breakout gap is a big void which traders will try and fill.  True 'Breakout Gaps' never fill, so while a violation of the gap is allowable, it shouldn't be allowed break below Monday's close, and ideally, hold above 3,050. The real winner is still the Russell 2000. A successful back-test of 868 would be very bullish. For Friday, look for more consolidation action. Although the next leg up will probably be a big one as what sideline money is out there is likely anticipating a higher move, particularly for the Russell 2000. --- Follow Me on Twitter Dr. Declan Fallon is the Senior Market Technician and Commu

Daily Market Commentary: Bulls Force Action

Image
A second big day of buying pushed markets well beyond resistance, but left markets exposed in the short term.  Traders looking for a sustainable rally would ideally like to see some low key action which held close to yesterday's highs. Technicals sharply improved, and any developing weakness from last week was reversed. The S&P pushed the boundaries of its consolidation on a fresh MACD trigger 'buy'.  However, larger gains in the Russell 2000 further diverged the relative relationship between Small and Large Caps; but this spreading relationship is net bullish for the market as a whole (because more money is flowing into speculative versus defensive stocks). The Russell 2000 broke clear of the September swing high in very bullish action.  The rising trend is nicely aligned with the fastest moving average (20-day MA) above the next fastest (50-day MA) and long term moving average (200-day MA); all of which are rising.  Small Caps are also showing their leadership

Weekly Market Commentary: Light Volume Selling Continues

Image
Seasonal light trading clouded what was a tumultuous week for the indices.  What few traders were playing the market this week did so on a background of fear.  Had selling volume been higher it would have been a troublesome end-of-week, but this may still be nothing more than a pullback. Breadth wasn't extensively damaged by the selling.  The Percentage of Nasdaq Stocks above the 50-day MA remained net bullish, at 53% stocks holding above this key moving average - down from 65%. The Nasdaq Bullish Percents actually scraped another 1% gain. It too finished the week with 54% of stocks on point-n-figure 'buy' signal. The Nasdaq Summation Index turned net bullish technically, despite closing the week lower. So market breadth isn't so bearish as last week's losses suggest.  The Nasdaq is in range bound territory, and could take a 100 point hit and not lose its longer based bull trend. The Russell 2000 probably has another week of losses to digest be

Daily Market Commentary: Eases Away From Resistance

Image
It was a day for relatively modest selling on light volume.  Largest selling came from the S&P, which finished yesterday against resistance. The larger decline in the S&P translated as a relative shift in favour of Technology stocks (Nasdaq).  The selling in the Nasdaq was much milder. The Russell 2000 finished the day flat, but since the start of December it has been the strongest index. There is a good chance there is more to come. Technicals remain strong. Tomorrow will probably be the last we will see of volume trading before Christmas. Things still look good for bulls with today's loss relatively minor. --- Follow Me on Twitter Dr. Declan Fallon is the Senior Market Technician and Community Director for Zignals.com . I offer a range of stock trading strategies for global markets which can be Previewed for Free with delayed trade signals. You can also view the top-10 best trading strategies for the US, UK, Europe and Rest-of-the-World in the Tra

Daily Market Commentary: Another Strong Day

Image
Yesterday was good, but today was surprisingly better. Volume climbed to register yet another accumulation day; the past four heavier volume trade days have been tied to buying. Bulls have the bit between their teeth. The S&P finished at resistance defined by September and October swing highs. Technicals are in excellent shape, but has it the momentum to break through? The Nasdaq put further distance from its converged 20-day, 50-day and 200-day MAs. Like the S&P, it is well placed technically to support further gains, although On-Balance-Volume only recently turned back to the green. The Russell 2000 had another good day, and relative strength continues to show strong leadership from the Small Caps sector. Look for this to continue in the days and weeks ahead. On a final note, the Nasdaq 100 - which had been lagging the Nasdaq a little - cleared resistance. It seems too much to ask if tomorrow will make it three good days in a row! --- Follow Me on Tw

Daily Market Commentary: Solid Rally on Good Accumulation

Image
The weekly charts left me thinking this would be a weak week, but Monday's action has thrown this negative outlook into doubt.  It was a solid gain, with markets gaining over 1% on higher volume accumulation.  It has set up the rest of the week nicely. The S&P worked a rally off its 50-day MA, with a 'Golden Cross' between the 20-day and 50-day MA likely to occur tomorrow. The Nasdaq is stuck in an interesting juxtaposition.  The 50-day MA is above to generate a 'Death Cross' to its 200-day MA , while at the same time, the 20-day MA is about to go 'Golden Cross' on the 50-day MA! The index itself rallied from its 20-day MA, to close above both 50-day and 200-day MAs. The Russell 2000 got the best of the action. It found support at 825 with a fresh 'Golden Cross' between 20-day and 50-day MAs. The index remains well placed to challenge 868 into the early part of 2013 - Fiscal Cliff or not. The frequency of posts is likely to dimin

Archive

Show more