Posts

Apple Comes In From The Cold

Image
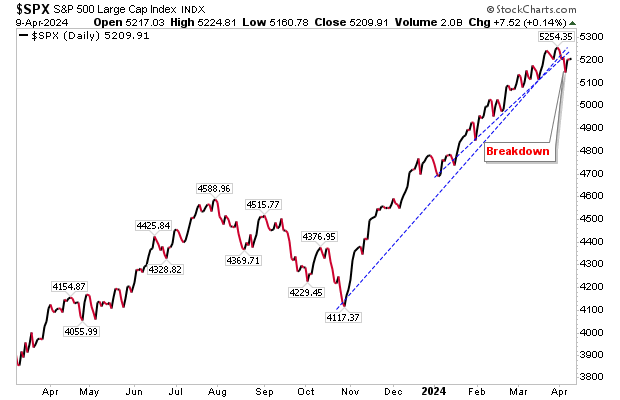
Introduction It will take a few days for markets to digest recent economic news, but it was clear before any announcements were made this week that the rally from October lows had stalled, and markets have now entered a new phase.  The S&P had broken its upward trend on the early week releases of CPI data and FOMC Meeting Notes, but had managed to rally back on positive news from Apple and Amazon. And while the S&P enters a tug-of-war period between bulls and bears, its still 10% above last summer's peak, and 25% above the lows of last October. A breakdown doesn’t necessarily mean a bear market is about to begin, it could simply be the slowing of its prior advance, and more likely, the start of a sideways shift in the market. Image: Stockcharts.com S&P long-term chart Investors will always fear the crash, but one only has to look at a long term chart of an index to see how these declines have ultimately just been pauses as part of a longer advance.  Image: Google Financ

Weekly charts of S&P and Nasdaq are only starting to breakdown

Image
I'll cover daily charts during the week, but I wanted to look at the weekly picture. Friday was an ugly day on daily timeframes, but weekly charts are holding up well. The Nasdaq is the in the early stage of a rolling top, but I would be looking to the 20-week MA to attract buyers, although in August 2023 this moving average only offered brief support befoer it was breached.

Nasdaq accelerates higher with sharp jump in relative performance

Image
Today belonged to the Nasdaq with Apple and Amazon key contributors to these gains. The index is now challenging the 'bull trap' after recent struggles. Again, we are likely looking at sideways action, but if there is follow through over the coming days it will mark a confirmed follow through for the index.

Russell 2000($IWM) squeeze continues heading into big economic news day

Image
Markets threatened a rout after sellers struck at Tuesday's open, but a rally after the hour managed to right the ship and by the close of business lead markets where showing "dragonfly doji" candlesticks. A dragonfly doji is typically a bullish reversal candlestick, but only in the context of an oversold market which is not the case here. Of course, later today we have a slew of economic data that could deliver dramatic swings in the market (both ways), so there is a certain level of pent-up tension leading into this. With that in mind, we have a Russell 2000 ($IWM) that continues to feel the squeeze as the ascending triangle trendline squeezes into breakout resistance and the March "bull trap". Trading volume has been very tepid over the last few days - typical of a consolidation - so look for this to pick up when support or resistance is broken.

Russell 2000 ($IWM) "ascending triangle" squeeze, with the Nasdaq and S&P struggling

Image
If there is a swing trade with plenty of tension ready to snap, it's in the Russell 2000 ($IWM). The index looks poised to either negate the late March 'bull trap', or crack below ascending triangle support with a big, red candlestick. Technicals still favor bulls, although the earlier MACD trigger 'sell' is a bit of a concern; note, MACD 'sell' triggers that occur above the MACD zero line are at best, weak 'sell' signals - often a good time to sell covered calls rather than offload a position. On-balance-volume continues to trend higher, and momentum as measured by stochastics is firmly above the 50 mid-level.. If there is a break of the trendline, then look for a move back to $187-189 in a likely continued evolution of a time-based, sideways consolidation. It's a bit of a different story for the Nasdaq as it returns to its breakout price on a move to challenge its 'bull trap'. This index has already broken trendline support, and

Russell 2000 ($IWM) finds support at rising trendline

Image
There wasn't much volume to Friday's trading, but there was enough to see buyers come in a trendline support in the Russell 2000 ($IWM). There was no technical change to the index with only a whipsaw signal in relative performance against the Nasdaq, although the MACD remains on a prior 'sell' signal.

Big bearish engulfing patterns as positive start negated

Image
It was a setting up to be a low key day, but come the afternoon, sellers pounced and drove markets down hard after doubts raised on future rate cuts. Fed news wasn't the key takeaway, but the loss of support was. The S&P was hardest hit, not because of the percentage loss, but because of the volatility relative to recent trading action. Today marked a clear breakdown of trendline support. It should be noted, the presence of the 50-day MA offers a point of defence but today's loss does not mean we will see a crash; a time-led consolidation seems more likely. Technically, the MACD accelerated its losses and there was a fresh 'sell' in On-Balance-Volume.

Archive

Show more