Stockcharts.com: Weekly review
For a shortened week it was certainly an active one. What has been shaken up since the new year rolled in?
Joe Reed included a new chart showing the Energy Sector Bullish percents; a clear sell signal is indicated.

Although his Oil Services weekly chart has reason for a bounce:

Of the indices he lead with the breakdown in the S&P, noting the strong bearish divergence in slow stochastics:

His monthly chart of the S&P is also showing a bearish ('sell') crossover in Full stochastics:

Mitchell Meana is still looking for a wave 4 bottom in the Nasdaq 100 - although the wide range spinning top from Wednesday looks to mark the wave 4 lows based on the upcoming MACD trigger 'buy' signal:

His Qs chart does show a wave 4 in place and he has maintained his wave 5 target of $46.29:

His Dow chart shows an A-B-C correction with a target for the 'C' leg of 12,325:

And he is calling a truncated 5th wave for the Russell 2000 iShares:

Ted Burge continues to call it as it is:
Further information is available from his website.
Robert New had one updated chart of interest; note the positive test of support:

I was surprised to see Richard Lehman as one of the few Stockcharters to note the break in the small caps:

He had this to say:
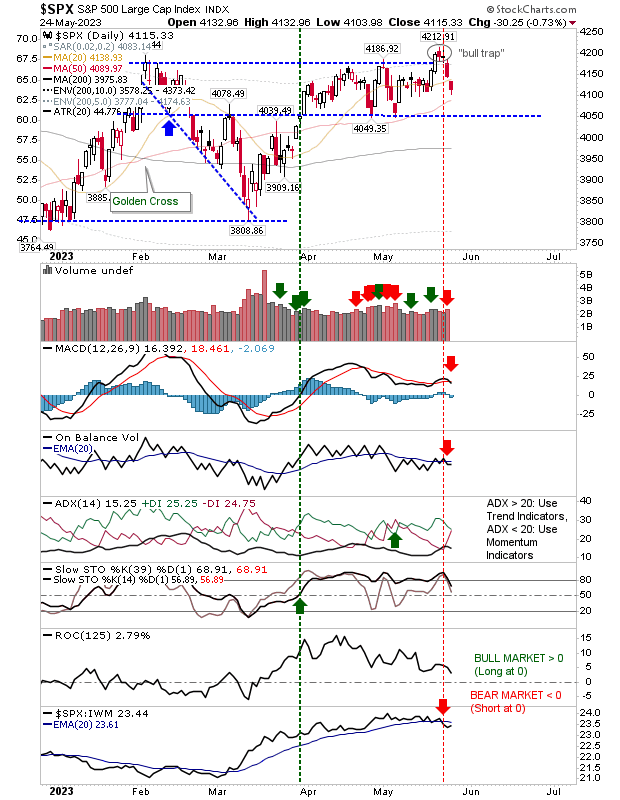
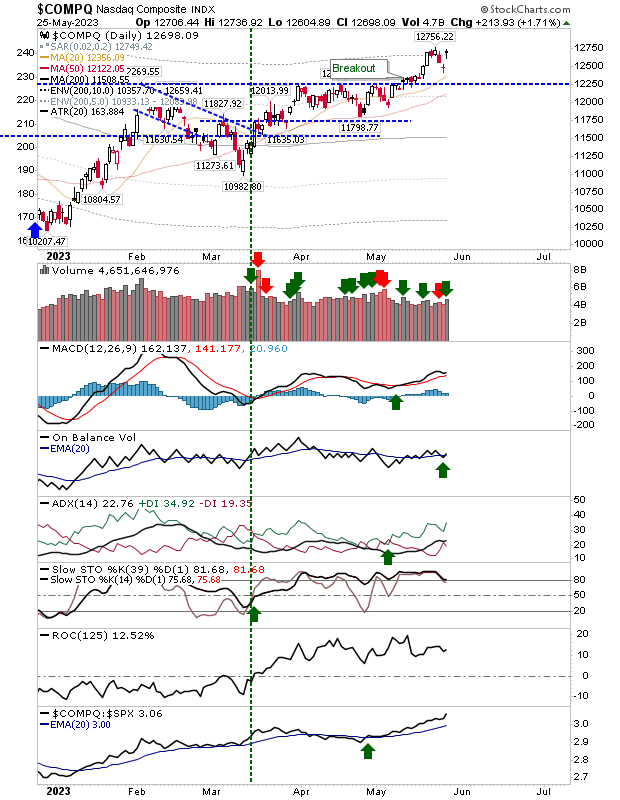
In summary, it would appear markets which had been trading sideways (Tech) or modestly upwards (Large caps) for the last couple of months have now started to show confirmed points of weakness which could drive greater losses.
Stockcharts.com
Joe Reed included a new chart showing the Energy Sector Bullish percents; a clear sell signal is indicated.
Although his Oil Services weekly chart has reason for a bounce:
Of the indices he lead with the breakdown in the S&P, noting the strong bearish divergence in slow stochastics:
His monthly chart of the S&P is also showing a bearish ('sell') crossover in Full stochastics:
Mitchell Meana is still looking for a wave 4 bottom in the Nasdaq 100 - although the wide range spinning top from Wednesday looks to mark the wave 4 lows based on the upcoming MACD trigger 'buy' signal:
His Qs chart does show a wave 4 in place and he has maintained his wave 5 target of $46.29:
His Dow chart shows an A-B-C correction with a target for the 'C' leg of 12,325:
And he is calling a truncated 5th wave for the Russell 2000 iShares:
Ted Burge continues to call it as it is:
Jan 5th, 2007! One sucessful experience after another and the feedback is simply incredible. We know there has been supply because the PnF report made it clear on December 22nd that SUPPLY WAS IN CONTROL and this has not changed. Be aware that supply is resistance and resistance to be respected. We don't know when supply will retake control, but we know where to look. Watch what happens at support and resistance and the rest will follow.
When BP's are high, it is time to be defensive. When BP's are low, it is time to be aggressive. (Not much question about this being true now, even if you ignored it over the last couple of weeks). No hype or predictions. It is all explained on my site. There is an e-book that explains more about TA than most have ever dreamed about understanding on the subject of support and resistance.
Further information is available from his website.
Robert New had one updated chart of interest; note the positive test of support:
I was surprised to see Richard Lehman as one of the few Stockcharters to note the break in the small caps:
He had this to say:
1/6 -- In the short term picture, the Naz and the QQQQ are hanging in there with their short term uptrends, but the Dow and RUT have gone into downtrends and the SPX was already in a slight downtrend. Longer term charts are now showing the beginnings of breaks that are finally compromising the upchannels from last July. These bear watching as the indices tell us whether we've just plateaued for a few months before rising again, or whether we are rolling over toward 1-year and 3-year support lines (which are quite a bit lower than we are now.
1/4 -- Magically enough, today's action helped make more sense of yesterday's roller coaster. The Dow is now showing a modified short term upchannel that simply changed slope upward from the existing one. This pattern won't fit the small caps quite as well, however, as their lower point yesterday is still out there all by itself (and the RUT may be in a downtrend). So while the indices are all seemingly in short term uptrends again, they just hit the upper lines and will likely back off a bit now.
In summary, it would appear markets which had been trading sideways (Tech) or modestly upwards (Large caps) for the last couple of months have now started to show confirmed points of weakness which could drive greater losses.
Stockcharts.com