Stockcharts.com: Weekly review
The last couple weeks of holiday trading haven't seen too much change in the markets. Things are unlikely to spice up until the week after next as markets will be closed for almost half of next week.
Not surprsingly, there wasn't many new charts to showcase given the lack of change. Joe Reed had commented:
His Dow chart showed support on the recent test:

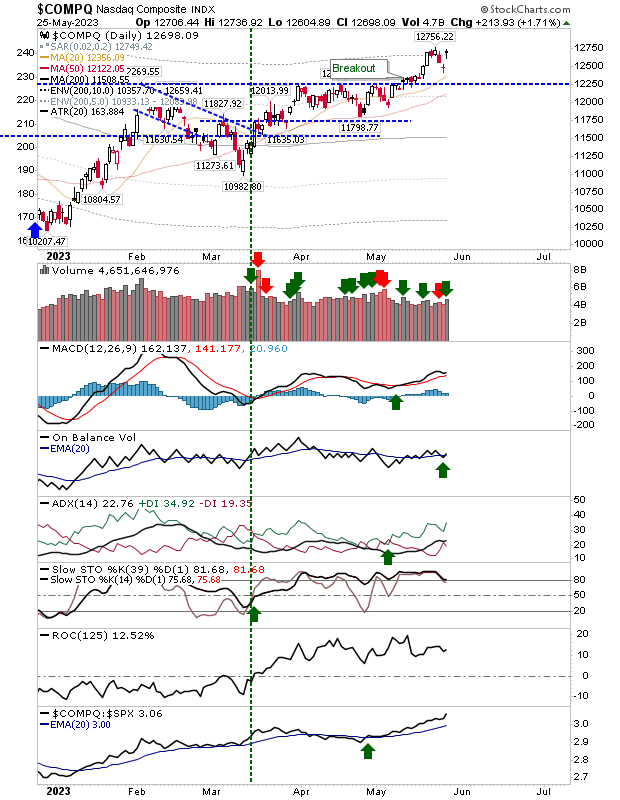
Similarly for the Nasdaq:

with a top marked in the Qs

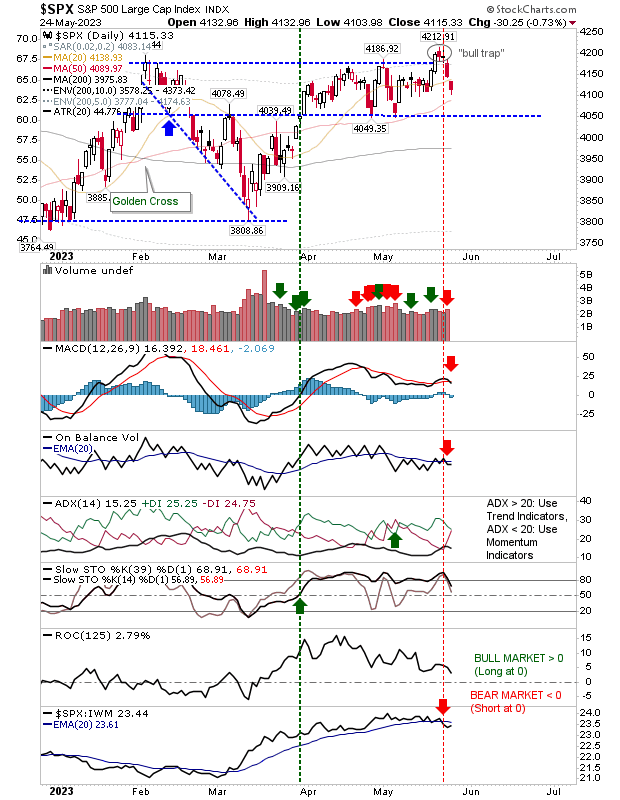
Although Joe hasn't noted it, his S&P chart shows clear bearish divergences in his RSI and Ultimate Oscillator

Mitchell Meana keeps things interesting as he looks for the wave 4 bottom:

Note: wave 4s are often marked by a MACD trigger cross below the bullish zero-line, so the Nasdaq 100 looks to be playing a wave 4 to form.
He set a Qs target of $46.29, so the struggles at the 50-day MA shouldn't last long???

Interestingly, he has marked in the top of a wave 5 for the S&P, so get ready to see some scrappy action as a ABC correction evolves:

Ted Burge opened with this:
Henri Staetmans has the Nasdaq reversing off resistance of a 2-year channel; part of a broad A-B-C correction:

Robert New notes a tiring of the S&P rally:

as his previous bullish divergence in the Crude Oil chart looks to be breaking down:

He has a nice Dow Transport chart; look for a move down to c4,400 before the bounce off support plays out:

and is expecting falling support marked by Jan and Apr 06 highs to be key for the long term health of the Nasdaq 100:

As I like to do I will finish with this comment from Richard Lehman - check out his 2 page list, it shows a key test of support for small caps and Nasdaq, with a strengthening rising channel nestled against larger channel reisistance for the Dow:
Have a Happy New Year!
Stockcharts.com
Not surprsingly, there wasn't many new charts to showcase given the lack of change. Joe Reed had commented:
*** Dec '06 - Here's what's happening now ***
THIRD QUARTER 'EARNINGS' came in Extremely High and that's one motivating force pushing stock prices higher. This may last for a while too, BUT eventually high earnings will become 'Unsustainable' (they always do). In the meantime, play the bull for as long as he lasts, followed with stop loss orders.
His Dow chart showed support on the recent test:
Similarly for the Nasdaq:
with a top marked in the Qs
Although Joe hasn't noted it, his S&P chart shows clear bearish divergences in his RSI and Ultimate Oscillator
Mitchell Meana keeps things interesting as he looks for the wave 4 bottom:
Note: wave 4s are often marked by a MACD trigger cross below the bullish zero-line, so the Nasdaq 100 looks to be playing a wave 4 to form.
He set a Qs target of $46.29, so the struggles at the 50-day MA shouldn't last long???
Interestingly, he has marked in the top of a wave 5 for the S&P, so get ready to see some scrappy action as a ABC correction evolves:
Ted Burge opened with this:
THERE IS SUPPLY! We trade support and resistance and supply is resistance. When BP's are high, it is time to be defensive. When BP's are low, it is time to be aggressive. No hype or predictions. It is all explained in my reports on my site and there is an e-book that explains more about TA than most have ever dreamed about understanding support and resistance and a ton of information about why many can't get it right most of the time.
You can learn how to trade in the NOW based on what is really happening 'right now' instead of getting whipsawed with opinions that are predictions for tomorrow with no basis (absolutely no basis) in TA and are pure guesswork.
TOMORROW IS NOT ON ANY CHART UNTIL TOMORROW. TRADE WHAT IS ON THE CHART TODAY and remember that dead cats do bounce.
Price is king and it can get costly if you don't understand how to analyze it! Let me teach you!
Henri Staetmans has the Nasdaq reversing off resistance of a 2-year channel; part of a broad A-B-C correction:
Robert New notes a tiring of the S&P rally:
as his previous bullish divergence in the Crude Oil chart looks to be breaking down:
He has a nice Dow Transport chart; look for a move down to c4,400 before the bounce off support plays out:
and is expecting falling support marked by Jan and Apr 06 highs to be key for the long term health of the Nasdaq 100:
As I like to do I will finish with this comment from Richard Lehman - check out his 2 page list, it shows a key test of support for small caps and Nasdaq, with a strengthening rising channel nestled against larger channel reisistance for the Dow:
12/30 --Upper channel resistance held firm for the large caps and Friday's little sell-off now has them heading down toward lower channel support lines. The small caps came down to channel support in their recent short term uptrends and barely held. The QQQ could arguably be breaking into a downtrend already.
I have to say that the long term picture is so toppy and the short term so complacent, that I see January as very risky for longs.The uptrends from July have now changed slope several times, flattening each time. That says the trend may have run its course. Few people would have wanted to sell at the end of the year and potentially pay a capital gain tax, so I suspect many held off.
Have a Happy New Year!
Stockcharts.com