Posts

Gains Consolidate in Markets

Image
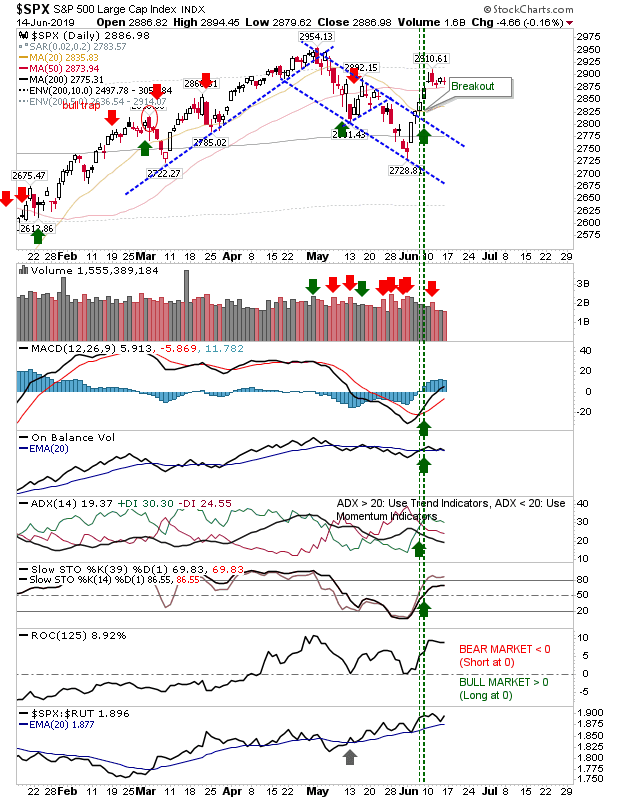
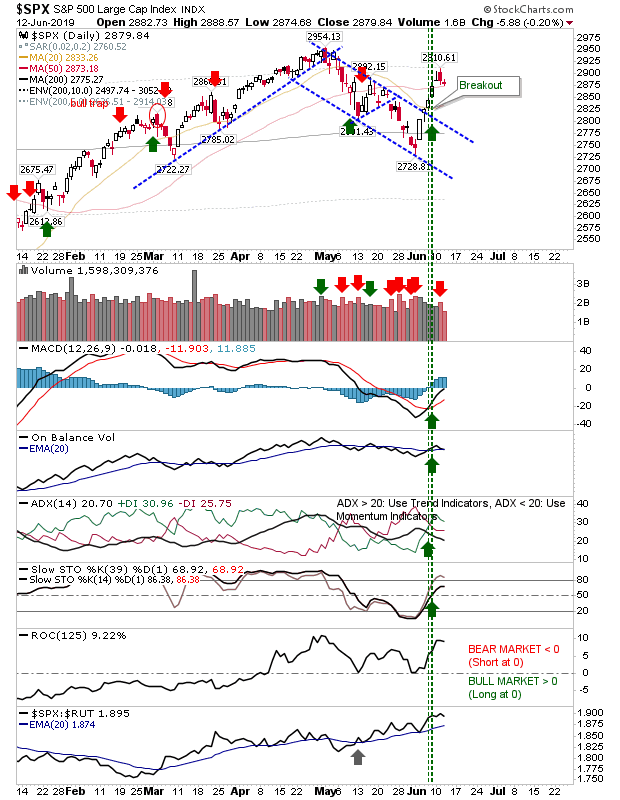
Friday's action was positive because so little happened. Markets had spent the first half of June rallying off lows, but last week was one where indices consolidated the gains. Not all indices were equal, but the effect was the same. The S&P closed with a doji - a doji which held above 50-day MA support. Volume declined in line with the consolidation; a positive behavior. Technicals are still net positive. Action points to a probable follow through higher and a challenge of the 52-week high of 2,954.

Kx Product Insights: Technical analysis of financial markets, what’s it all about?

One of my pieces I wrote for the Kx Systems Insights blog: "For this month’s blog post we will delve into the mysteries of technical analysis of financial markets.  Kx Dashboards come with two built-in financial charting packages which can be used to demonstrate technical analysis. In this article we will use the Financial Chart component. Our next article will look at some of the tools in ChartIQ." Read More

Net Bullish Technicals for S&P and Nasdaq

Image
Since the last update we have seen significant technical improvement, even if the indices registered losses over the last couple of days. The S&P is now resting near its 50-day MA but there may not be sufficient wiggle room for it to be held as support. If this was to fail then next would be former channel resistance now support.

S&P and Nasdaq confirm breakouts; rallies start to build

Image
The S&P and Nasdaq were last to follow the lead of the Russell 2000, Dow and Semiconductor Index. It's now looking like respectable swing lows are in effect for all lead indices. For the S&P there was a close above the 50-day MA in addition to the follow through breakout. Technicals returned net bullish, making the 52-week high of 2,954 as the next challenge for the index.

Archive

Show more