Posts

Semiconductors kick on as bounce reaches extremes

Image
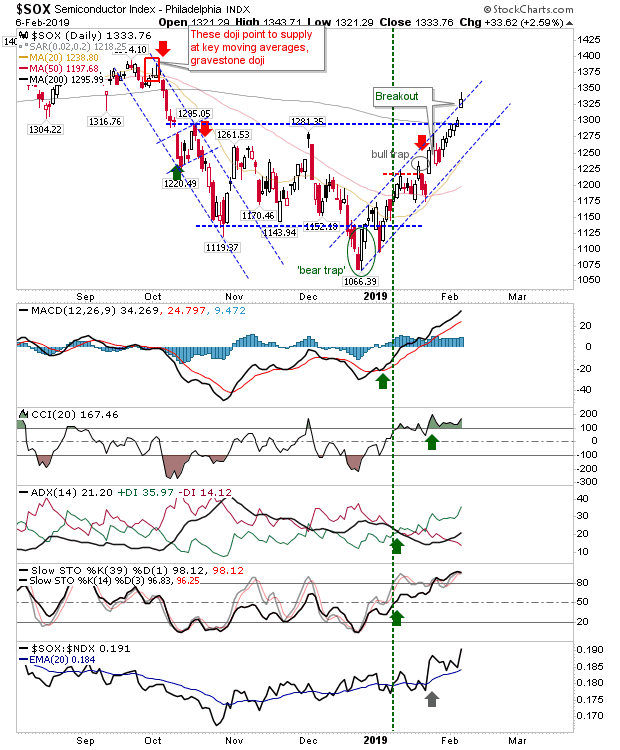
This bounce which kicked off in December has reached levels which are getting rich for many but not for the Semiconductor Index. The Semiconductor Index gapped higher which keeps it hugging the channel resistance line but also offers a buffer down to support; today's action registered as a breakout. Technicals are in good shape and relative performance is good.

Quiet Friday helped maintain indices breakouts

Image
Friday's action in the indices didn't do a whole lot, but what it did do was help carry last week's breakouts through the weekend. The breakouts were fairly modest and overhead resistance in the shape of 200-day MAs is still a concern for some indices, but last week's action is favorable for bulls. Tech indices were the primary driver last week with the Nasdaq clearing declining resistance with a decent looking breakout on higher volume accumulation; better still is the sharp advance in on-balance-volume - a sign of sustained interest from Big Money to participate in this rally. The Nasdaq does enjoy a relative performance advantage against the S&P, the question is whether it can sustain it.  It still has the 200-day MA to overcome but momentum and short term traders may still be able to eke out a trade on a test of this key long term moving average.

Bullish Accumulation

Image
A good day for bulls delivered a breakout in the Dow Jones Industrials Index and across the board accumulation for other indices Action in the Dow Jones Index delivered not just a break of declining resistance but a close above the 200-day MA. Technicals are net positive but not yet overbought.

And so the Shorts dance continues...

Image
It seems every market gain is soon followed by a loss (and a potential shorting opportunity), but each time shorts are left hung out to dry. Will this time be different? Probably not, but whipsaw trades remain a key risk after a bounce like the one we have seen. Of the low hanging fruit, we have a Dow Jones Index which has reversed off resistance (and 200-day MA), albeit with a small bullish hammer (the significance of which is reduced as the index is overbought on near term stochastics - but not on an intermediate time frame). The 50-day MA is available to use as support, and relative performance is positive versus the Nasdaq 100. While action suggests this will break through its 200-day MA, the short position has a small edge until proven otherwise.

Archive

Show more