Posts

Nasdaq Technicals Net Bullish as Breakout Readies

Image
Things looking good for the Nasdaq as technicals return net bullish after a brief period of bearishness. This coincided with the index nestled against resistance helped by Friday's tight intraday action.  The index is nicely placed for a breakout on Monday, especially given the relative out-performance of the Nasdaq against its peers.

Markets Rally, But Still Work To Do.

Image
A positive response to Friday's selling helped erase those losses, but for many indices it wasn't enough to recover support or reverse technical 'sell' triggers. The S&P is on the verge of a 'death cross' between 20-day and 50-day MAs as the rally finished just below the 50-day MA. The consolidation channel remains in play and this should see higher prices in the latter part of the year, but for now, it's drifting down in a relatively controlled manner.

Markets Net Bearish Technically

Image
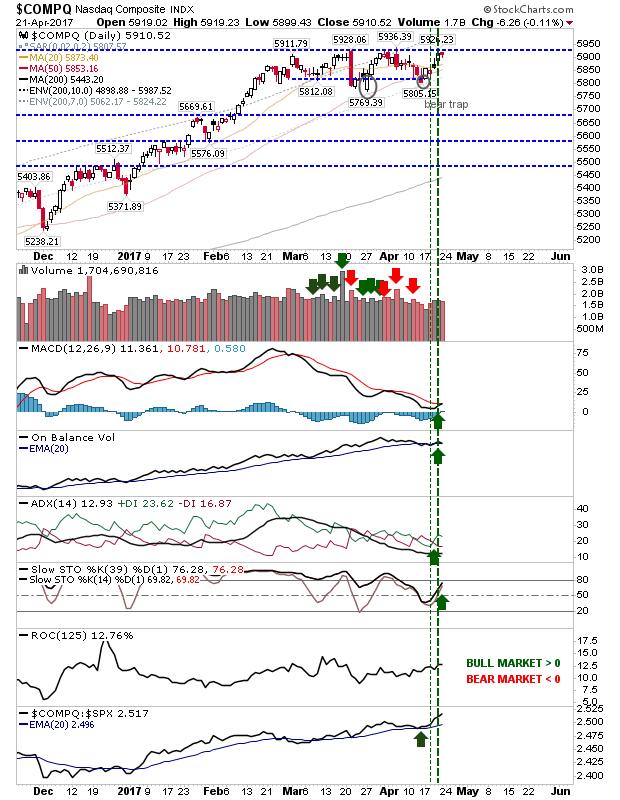
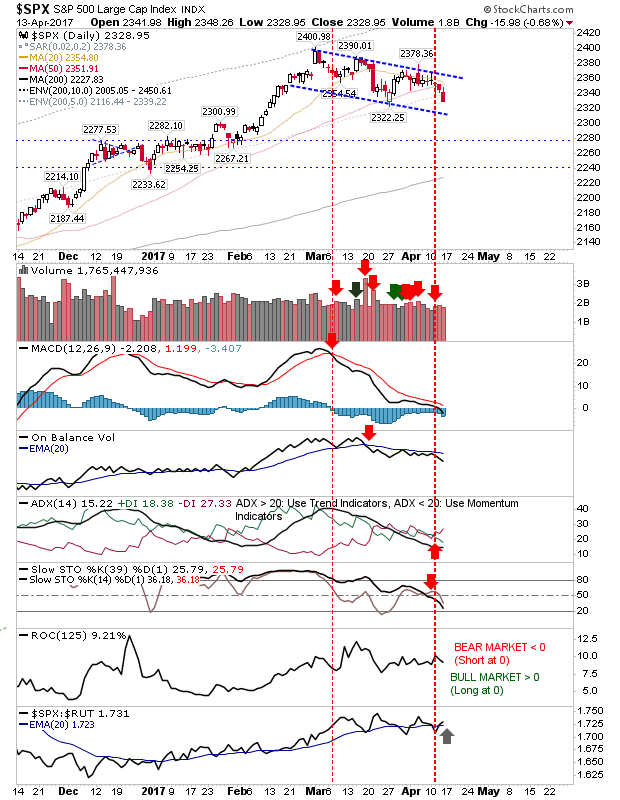
It has been a while since markets were net bearish, but the S&P, Nasdaq, Nasdaq 100, Dow Jones Industrials and Russell 2000 are all now net bearish in technical strength. Adding to this is a number of these indices have also broken from support channels. The best case for bulls is that markets shift sideways and work out the bearish technicals - building for the next rally. But if there is an acceleration down it could snowball in a manner similar to how markets rallied after the election. It's not a time to buy, and it may not be a bad time to sell or short.  Long-term investors will probably stick as there is no way of knowing what may come - and an extended period of weakness is due which shouldn't worry investors (the March 2009 low I still view as a generational low). The S&P wasn't the biggest loser on Friday and this was reflected in the relative improvement of the index to its peers. The downward channel could still play as a 'bull flag', but if th

S&P Drops Below 50-day MA

Image
The good work from yesterday was undone with today's selling.  The S&P posted a clear break of the 50-day MA on modest volume and will next be heading to test support of the declining channel - which at the moment looks more like a 'bull flag'.  Technicals for the index are net bearish, but are close to a recovery. It might look worrying, but the index could benefit in the long run.

Archive

Show more