Posts

Meh Part II

Image
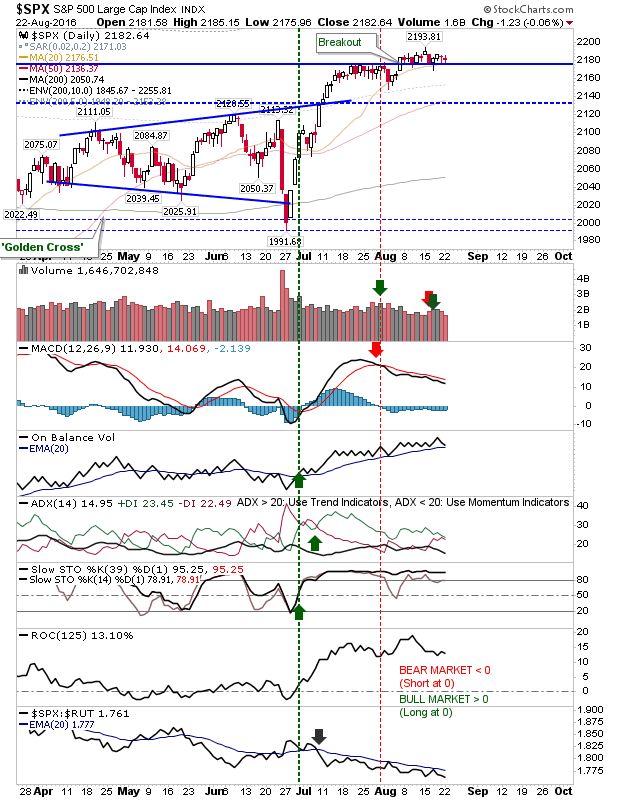
The week started much like past week's finished with a whole lot of nothing. No volume, no action, no outlook. At least the S&P is holding breakout support. Watch for 'sell' triggers in +DI/-DI and On-Balance-Volume. The Nasdaq managed to gain a little, waiting for traders to break it out of its range.

Semiconductors Continue To Advance

Image
Markets continued with their sideways pattern in a refusal to succumb to easy profit taking.  The exception looks to be the Semiconductor Index which continued to advance. The only disappointing aspect to the Semiconductor Index is the failure in the MACD to kick higher. It's not a deal breaker as price action and other technicals are very healthy.

S&P Breakout Support Holds

Image
The weak start didn't deliver a rout in markets. Instead, after the obligatory first half-hour of trading came the (bullish) reversal which lasted the rest of the day.  The overall picture hasn't changed, with the S&P stuck inside a narrow range, but a panic sell-off looks less likely now. Buyers look keen to defend drops below 2,170 in the S&P.  Volume climbed to register accumulation, despite general holiday volumes. Bulls will want to see a fresh MACD 'buy' to confirm an end to an effective 7-week consolidation.  Aggressive traders can look to the 20-day MA for buying opportunities and/or trailing stops.

Profit Taking

Image
While volume climbed to rank as distribution there wasn't a significant relative loss for markets.  However, the selling perhaps marks an indication that the summer lull is a maximum for the Brexit recovery. Today's selling started yesterday and continued through the day. The S&P shows this with the Inverse Hammer followed by today's red candlestick combo. The support line from the Jobs Data breakout hasn't been breached and this may be enough to keep longs in their positions. However, a weak open tomorrow could open the flood gates, and a loss of 2,160 may see others pile in.

Archive

Show more