Posts

Shorts Rally - But For How Long?

Image
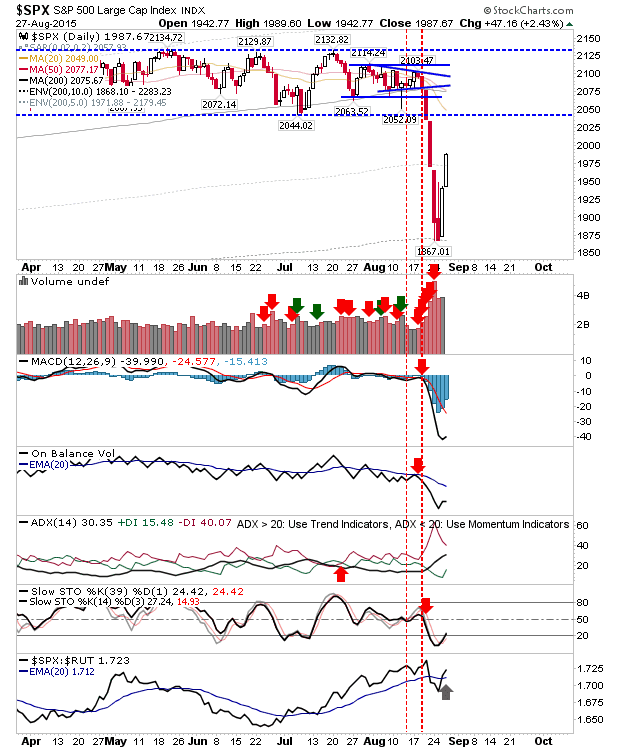
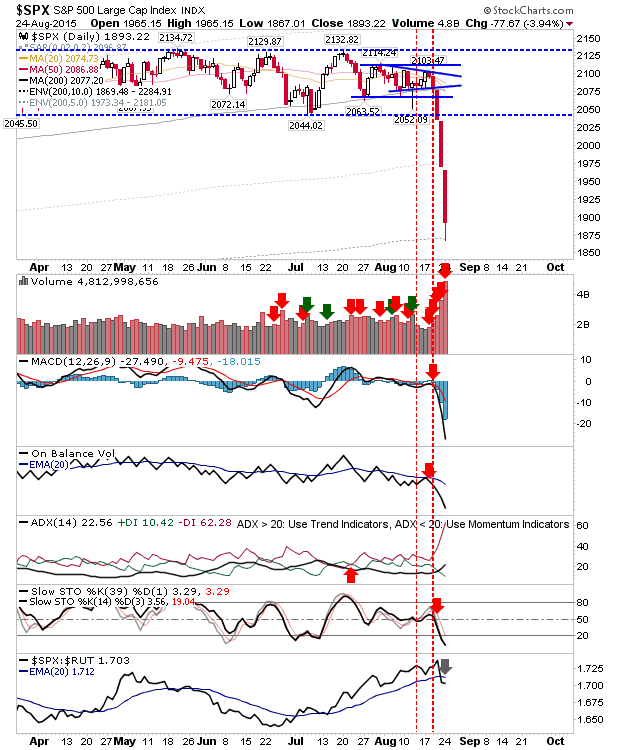
A second day of gains keeps pressure on shorts in squeezing them out of their positions, but is also looking to sucker shorts into trying to second guess when this rally will end. The S&P is heading fast towards 2,044. Given the speed at which it has enjoyed this advance it will be there by Tuesday! In reality, it will likely slow before it gets there. When markets do head lower it will be important they do so slowly to sow further doubt into shorts.

Selling Pummels Markets

Image
The third day of selling pushed markets deeper into oversold territory and potential long term 'buy' territory. In my 'bottom' tracker, the S&P is priced in the 90% zone (i.e. only 10% of historic prices relative to the 200-day MA have been worse), while the Nasdaq and Russell 2000 is in the 85% zone. It has been 4 years since markets have been this oversold. The S&P made a picture perfect tag of the 10%, 200-day Envelope. Although with trading restrictions in place at market open it would have been difficult to get a fill at this price. But now is a time to be shopping for value in individual stocks

Near Term Oversold, S&P and Russell 2000 in "Accumulate" Zone

Image
Friday's action washed out bulls and likely scared off any buy-the-dip players.  Longstanding trading ranges from 2015 were decisively breached on heavy volume. However, selling has reached a point where there is good chance of a rebound on Monday. Both the Russell 2000 and S&P reached the "Accumulate" marker, where long-term buyers can chase value in the market. The last time this scenario played for the S&P was November 2011, although it was October 2014 for the Russell 2000. The S&P tagged the 5% envelope band of 200-day MA, an area which will give bulls a chance to mount a snap back rally to the 200-day MA, and a place where long term buyers can look to buy value in the market.

Buyers Report Absence

Image
No denying who took control today. Buyers will have their work cut out if they are going to regain it. Today's dominant red candlestick will likely see some come back tomorrow, but eating back all of today's losses will be more difficult. The S&P lost over 2%, knocking out 2,045 support and returning all technicals into the red. Volume climbed as distribution. The 200-day MA is now the line on the sand for bulls. The loss is significant and will not be easily recovered.

Archive

Show more