Posts

Swing Trade Tuesday's Narrow Range

Image
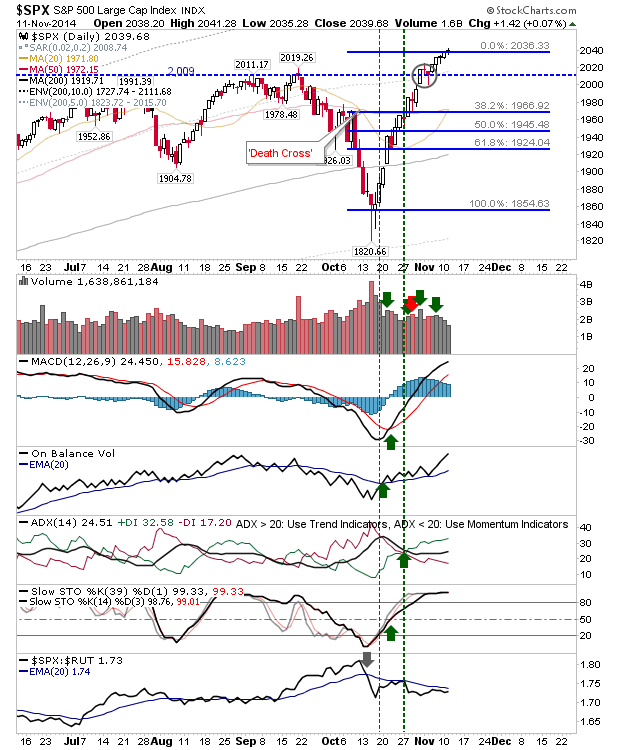
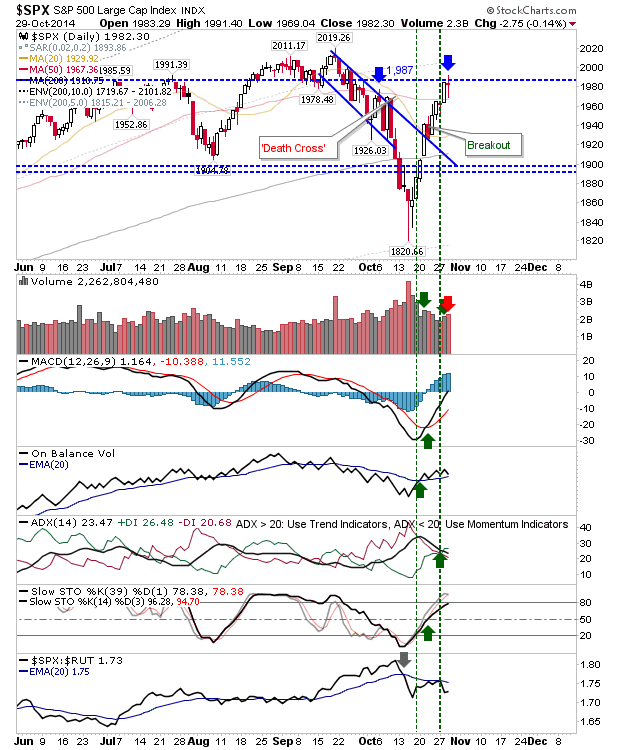
All indices traded themselves into very narrow ranges - offering the potential for a big move once today's high/low are breached. It's the kind of market where everyone is expecting the rally to collapse, but no one wants to make the first move. Which is why this rally will probably keep moving higher; even if all buyers are in, shorts will have to cover if there is another surge - which will bring more buyers in. One thing which is happening is the reduction in buying volume. The S&P is unchanged.

Further Minor Gains Extend Rallies

Image
There wasn't much to today or Friday, but bulls kept the pressure on shorts in existing positions. The Russell 2000 had the best of the (modest) action, edging a breakout from the narrow, 6-day handle. A move to upper resistance remains favoured; watch for a 'bull trap' on an undercut of breakout support.

Dow Pushes Well Past Breakout Support

Image
Another day of gains for markets, but it was the Dow which is best positioned to benefit. The Dow is out of range of the easy short with an undercut of breakout support: one day of loss might not be enough to see this level tested, given net bullish technicals and a MACD at a new high.

Some Bullish Follow Through To Yesterday's Breakout Defense

Image
The shorting opportunity presented on yesterday's intraday close didn't last the morning. The S&P opened above 2,009 support and this level didn't get a look in through the day. I have widened the Fib levels, but there is a chance it will push higher tomorrow.

Late Rally Maintains Breakout Support for a Second Day

Image
Today looked a lot more bearish on an intraday chart than it did on the daily chart. For example, the daily chart in the S&P closed with a bullish hammer, but as with any reversal candlestick, a 'bullish' candlestick is considered bullish when in an oversold market - and this is not an oversold market.  However, the rally did enough to maintain a close above 2,009.

Pause in Rally Maintains Friday's Gains

Image
Friday's breakouts were small, and vulnerable to selling and 'bull traps', but today's action stayed close to Friday's highs, keeping bulls happy. The S&P has breakout support at 2,009 to work with, but it's hard to see this holding when sellers do return. The S&P has Fib levels, of which the 61.8% level close to the 200-day MA would offer an ideal opportunity - but there are plenty of support levels to work with on its way there.

Indices Break to New Highs

Image
Another days' gain, another set of breakouts in the bank. The Dow took out the September 'bearish evening star' with Friday's close.  At some point, this rally will have to confirm one of these levels as support, but for now, a new support level has been created.

Nasdaq 100 Ready to Break?

Image
All of the indices are threatening a break to new highs, but the first to do so may be the Nasdaq 100.  The last three days have shaped a small handle, defended by the breakout gap for support, and lurking very close to the breakout threshold at 4,118. Technicals are net bullish although it's underperforming relative to the Russell 2000, which may delay money flow into the index.

Indices Pause at Resistance

Image
Yesterday's decent gain was followed with a consolidation today. The relatively wide intraday range finished with a flat close; a close which remained in the range of resistance. The S&P has a resistance level at 1,987 based on the July high with supply kicking in around September congestion.  This may evolve into a bearish head-and-shoulder reversal: for this to happen, look for a move back to 1,904 (August swing low) without a close above 1,987.  Technicals are bullish, along with the bullish trend in the 200-day MA, so a head-and-shoulder reversal would run against the technical picture. The Nasdaq is coming up against former support turned resistance, and may offer itself as a shorting opportunity. Meanwhile, the Russell 2000 is trading around its 200-day MA. Given the relative leadership of this index, and the fact other indices have breezed past their respective 200-day MAs, I wouldn't look for the Russell 2000 to linger here for too long as it continue

Daily Market Commentary: Powerful Rally

Image
An excellent day for bulls, particular for the Russell 2000. In the case of the latter index, the Small Caps Index broke declining resistance and 200-day MA in an almost a 3% gain. There was also an uptick in relative performance of the Russell 2000 against the Nasdaq and S&P.  This is well placed to continue into a test of the June high (with the September high next).

Pullback on Hold

Image
A rapid bounce, a one-day sell off which looked like something more, then a return to buying. There were important breakouts, but shorts are not out of the game yet. On the breakout front there was the S&P. Yesterday's selling didn't return below support and today put some distance on it. The 50-day MA may play as resistance tomorrow, but given it has flat-lined it may not play as big a role in this regard.

Time for the Pullback?

Image
Sellers were going to make an appearance at some point and today was the day they paid a visit. Whether a larger pullback emerges will depend on events over the coming days, but today's selling did occur at some natural attack points for shorts. The S&P finished with a 'bearish cloud cover,' but it did manage to hold declining resistance turned support. The 20-day MA has also entered the fray as an area for bears to work. But this wasn't the most bearish of the indices, and today's finish actually gives bulls a long play tomorrow (for a bounce off support).  Technicals also suggest a bounce.

Has The Bounce Gone Too Far?

Image
A fourth straight gain has probably caught bulls by surprise in as much as it has hurt bears. What I had thought would evolve into an Adam-and-Eve bottom may instead become a plain 'ol "V"-bottom. What this sequence of gains does is it generates lots of underlying support for buyers to step in on the next sell off. The S&P was able to break declining resistance and close above its 20-day MA. Volume climbed to register accumulation, although overall volume was well down on earlier selling.  Bulls would probably welcome some tight action near today's highs to help digest these gains. Today didn't give any indication of a bear attack on the 20-day MA.

Bullish Finish for Indices

Image
Today had the kind of action which allows bulls sleep easy: steady buying action from start 'til finish. If there is a concern, it was opening gap downs which greeted some indices. The semiconductor index didn't deliver on its island reversal, but it may yet do so tomorrow. Those who bought today's open will be sitting pretty. What may contain bullish enthusiasm is the presence of overhead resistance at the 200-day and/or 20-day MA, but I still like this for an opening upside gap.

Bulls Work on Establishing a Market Low

Image
Friday's gains helped put some distance on Wednesday's spike reversals. This will offer bulls something to defend when selling inevitable returns. Friday's action didn't all go bulls' way as key moving averages played a role in halting the advance for a couple of indices. In the case of the Nasdaq, the blocker was the 200-day MA. Friday's high tagged the 200-day MA before weakening - although there was a bit of a recovery into the close. The index is no longer oversold, giving bears an opportunity to turn the screw again.  However, a close above the 200-day MA would give bulls confidence that last week was a low of note.

Contained Buying for Indices

Image
It wasn't the day I expected, but bulls can take some comfort it wasn't worse.  Some indices fared better than others. The S&P finished on the bearish side, despite closing a little higher. The inside day to yesterday's wide range day looks like something which will deliver more weakness in the days ahead. A close above yesterday's high would confirm a bottom (maybe not 'the' bottom), but this is something for tomorrow. A 2011 style bottom would still need another 5-6% decline to suggest this.

Bullish Engulfing Pattern in Russell 2000 and Semiconductor Index

Image
While I think markets are close to a swing low, I'm not entirely sure the bottom is there yet. The wide range day and spike lows are setup for a walk-down retest of these lows over the coming weeks. However, today was a step in the right direction for a near term bounce. Best of the action was in the Russell 2000 and Semiconductor Index. The Russell 2000 finished with a sizable bullish engulfing action that finished the day next to channel resistance. Tomorrow is set up for an upside channel break.

Volatile Flat Day for Indices

Image
Contained Volatility is perhaps the best way to describe Tuesday's action. By the time markets closed there was little change from open prices, but it was a bit of a roller coaster ride getting there. Not surprisingly, Small Caps had the best of the action, although relative to what's gone before it was a small change, but it's making big ground relative to Tech and Large Cap indices. The index remains within the sharp falling channel, which is unsustainable in the short term and will likely break upside sooner rather than later. At that point, I would be looking for a trading range in preparation for the next move up or down.  It has already tagged the 10% bottom percentile of loss relative to the 200-day MA (at -8.8%, taken from table below), so now is a good time to be taking nibbles on fundamentally strong Small Caps trading at a discount: look for Small Caps breaking or trading near highs (not necessarily 52-week highs: I like looking at action near 6-month highs).

Third Big Sell Off in a Row.

Image
The S&P took another big hit to the face as sellers rushed to the exits in late afternoon trading. The 200-day MA was barely noticed on the way down and the August swing low cleanly sliced.  Technicals are oversold and volume is in line with a capitulation, although I would be more comfortable calling a bottom once the index is at least 10% below its 200-day MA (which is 1,714).

Semiconductors Hammered

Image
While markets experienced broad selling, it was semiconductors which took the brunt of sellers wrath on weak prospects for the sector. Unfortunately, given the importance of semiconductors at the heart of Technology and therefore, the global economy, there will likely be further repercussions going forward.  The near 7% loss in the Semiconductor Index paid no respect to daily support, opening up support levels on the weekly time frame. The 200-week MA has entered the 61.8% fib retracement zone and is a potential target for the months ahead.

Archive

Show more