Posts

Large Cap Indecision, Bearish Small Caps and Tech

Image
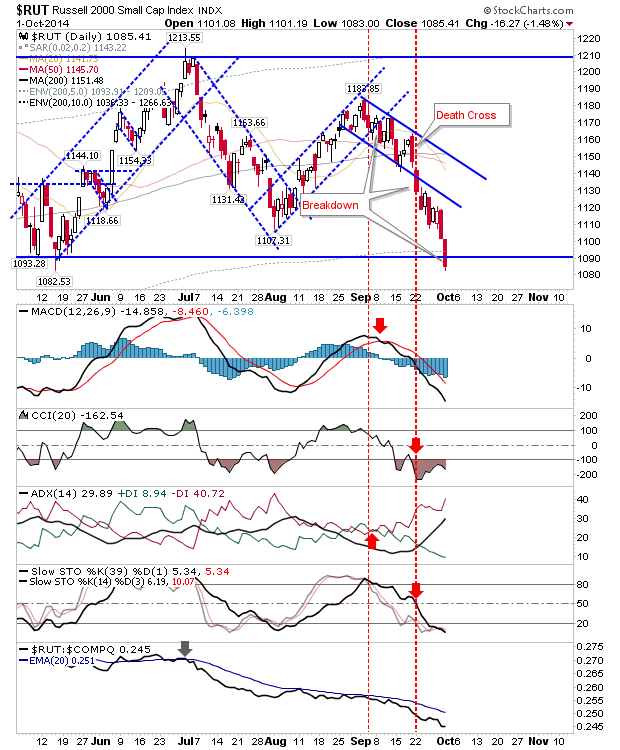
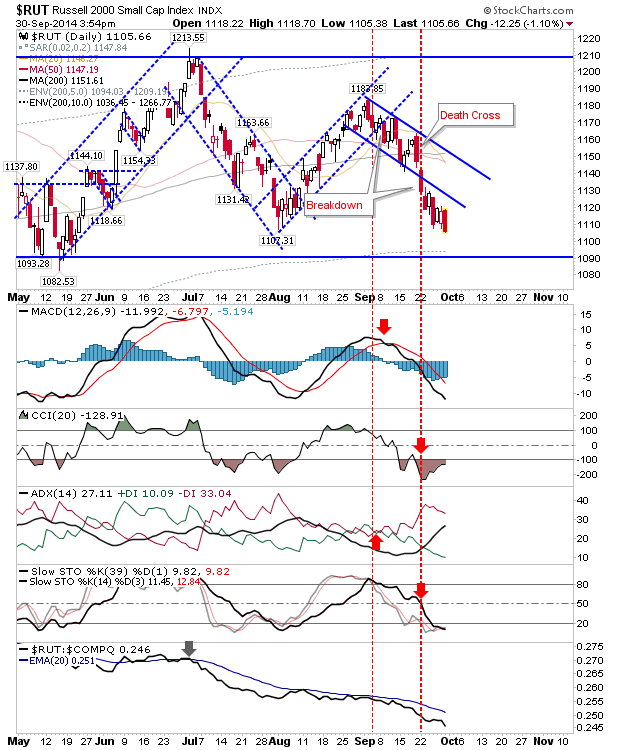
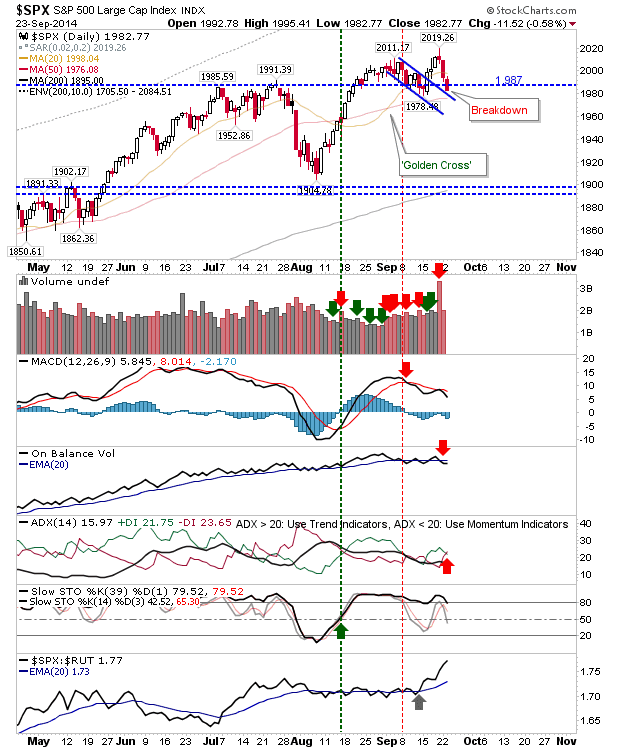
Bears did a good job of keeping selling pressure in play with bearish engulfing patterns in the Nasdaq and Russell 2000. There was less on offer from Large Caps, although defensive indices are not as likely to succumb to bearish pressure. The Russell 2000 eroded what little wiggle room it had to support. However, it didn't break 1,090 or challenge the 'bear trap'. There was an excellent article on Andrew Thrasher's blog about a potential bearish head-and-shoulder pattern in the Russell 2000, which makes a lot of sense.

Low Volume Rebound - Relief Rally Done?

Image
The easy work for bulls is done, now the real graft begins if overhead supply is to be consumed. A couple of indices sit at resistance levels more suited to short positions, but shorts haven't had too many opportunities beyond the recent 'bull traps'. The Nasdaq is perhaps the most vulnerable. It tagged former support turned resistance with the 50-day MA just overhead.  A another leg down to test 4,325 would appear more likely, although a strong start on Monday would put a short position on hold.

'Bear Trap' in Russell 2000

Image
I'm not entirely convinced by today's bounce, but it does set a baseline on which to measure risk. There are a couple of long side opportunities. The first of which is the Semiconductor Index: it has reached the bounce zone a little earlier than expected, but while it honors this converged support it has long-side potential. Stops go on a loss of 608.

Concerted Bear Move

Image
Bears haven't had too much to cheer as every sell off has been quickly reversed, but today they were given the run of the house. The Russell 2000 was the weakest index heading into today, and it was slapped with another big hit today. However, bulls probably have the best chance for a bounce trade in this index. The index saw a clear cut below the 200-day MA and 1,090, but a push above these levels tomorrow would set up a 'bear trap'.

Small Caps take the brunt of selling

Image
The aversion to risk continued with Small Caps edging a break below the July swing low on a loss of nearly 1.5%. However, the larger trading range is intact until 1,090 is lost. The 200-day MA is also nearby to lend support. As for today's action, more selling is favored for tomorrow, although action in other indices isn't pointing so bearish.

Friday's Bullish Picture Holds Despite Mild Selling

Image
Friday's buying volume was disappointing, but indices held on in the face of today's distribution. Today's lows mark the new support level for stops, although moving averages are also playing as a broad brush of support. The S&P finished with a doji on its 50-day MA.  Technicals remain mixed with a bearish slant in MACD, On-Balance-Volume, and ADX, but with momentum on the bullish side.  The index is tied below 1,987 resistance, but is positioned for a challenge of this level tomorrow.

Daily Market Commentary: A Recovery Lacking Volume

Image
It was a noble effort on the part of bulls, but it lacked the volume to really pressure bears.  However, Friday's action did offer bulls something to work with on Monday, while bears have one option to play with. The Nasdaq is working on a possible 'bear trap' with a return above the 50-day MA, and a close above 4,485. Risk is measured on a loss of 4,475.

Daily Market Commentary: Reversing Yesterday's Gain with a Bigger Loss

Image
It proved to be an ugly day all around. Yesterday's recovery rallies were quickly taken out with today's heavy losses. Attempts to find support at 50-day MAs and/or channel support were pushed aside. However, these losses have some way to run before August swing lows are challenged. The S&P could look to mount a new rally, although I suspect it will struggle to get close to 1,987.  If it can't move above its 50-day MA, or finds resistance near this moving average, then shorts will have an entry opportunity for a push down to August swing lows and/or 200-day MA.

Daily Market Commentary: Bullish Engulfing Pattern in S&P on 50-day MA

Image
An important day for the S&P when a successful test of the 50-day MA was combined with a bullish engulfing pattern.  Better still, the index was able to finish above 1,987, a key support level. Technicals are seeping negativity, but not enough to be outright bearish.

Daily Market Commentary: S&P Possible 'Bull Trap'

Image
It's perhaps a bit of a reach, but the S&P closed below key 1,987 support in what could turn into a 'bull trap'.  What makes the 'bull trap' a tenuous conclusion is the 3 day decline required to get it there. Also, the index hasn't yet tested its 50-day MA, this should be an area of demand.  Technicals are developing bearish, but are not net bearish. Bulls will have another opportunity at the 50-day MA which could see a test tomorrow.

Daily Market Commentary: 'Bull Trap' Confirmed in Semiconductor Index

Image
The failed breakout in the Semiconductor Index expanded with another loss above 1%.  Monday's loss took it below the 20-day MA, kept the MACD 'sell' trigger in play and generated a CCI 'sell' trigger.

Daily Market Commentary: Higher Volume Selling, and Bearish Engulfing Pattern in Russell 2000 and Semiconductor Index

Image
In day when Alibaba took the headlines , it was left to the Russell 2000 and Semiconductor Index to warn of potential change. The Russell 2000 experienced a large bearish engulfing pattern, although within the boundaries of the declining channel. There was an undercut of the 200-day MA, which will need to be watched on Monday. Shorts could get aggressive with a stop above 1,164 (and/or declining channel line).

Daily Market Commentary: Accumulation

Image
Bulls had another good day; a third good day in a row.  The Dow capped the day with a breakout into what could turn a larger measured move higher. Volume rose in accumulation, and residual bearish technicals were negated on the move higher.

Daily Market Commentary: Semiconductors Advance

Image
It was a roller coaster day, but the Semiconductor Index was the one to finish with an edge to the bulls. It looks like a break of 652 will happen sooner rather than later, with the swing low at 631 a handy place to mark risk (for a stop).

Daily Market Commentary: Breakouts and Bullish Reversals

Image
The bullish reaction was swift and strong.  Shorts who took advantage of the break of support were quickly put on the back foot. The S&P regained 1,987 support and delivered a breakout of the declining channel. Technicals will take a few days to recover, but relative strength took a sharp swing in Large Caps favour.

Daily Market Commentary: Small Caps Take Another Hit

Image
Headlines may have suggested otherwise for markets, but Small Caps had a rough day. The Russell 2000 lost over 1% in a slice through both 50-day and 200-day MAs. It's ugly because Small Caps have to re-establish a new price channel and each daily loss makes this new channel less and less bullish. Technicals are not net bearish, but they are not looking good either.

Daily Market Commentary: Distribution Returns

Image
It was a second day of heavier volume selling in four for the S&P, and the fifth day of distribution since the last accumulation day. The breakout of 1,987 was undercut by Friday's close in addition to a finish below the 20-day MA. Bulls still have room for maneuver with the 50-day MA next in line for a test; even a modest rally Monday would be enough to return the S&P above its breakout.  The higher volume selling is a concern, but not a deal breaker for bulls...yet.

Daily Market Commentary: Strong Day for Russell 2000

Image
It was a modest day for the S&P, Dow and Nasdaq indices, but it was a better day for the Russell 2000. The recovery in the Russell 2000 after the channel breakdown took a big step forward as it worked itself off its 50-day MA and finished above its 20-day MA. The breakdown remains, but this will likely shape itself into a broader (more shallow, and therefore more sustainable) rally.

Daily Market Commentary: 20-day Moving Averages Hold For Now

Image
Buyers made inroads into yesterday's relatively mild losses. The point of defense were 20-day MAs of the S&P, Dow, Nasdaq and Nasdaq 100.  The Russell 2000 found its love at the 50-day MA, although the 20-day MA is only a few points above it. While this offers near term upside opportunity, it has been rare for the 20-day MA to act as a launch point for a longer rally. Don't be surprised if this MA is again revisited next week. The S&P has perhaps the most to gain given the significance of 1,987 support as it looks to push beyond the psychological 2,000 level. If there is a concern it's that technicals are favouring an expansion of the weakness: a move to the 50-day MA may be needed first.

Daily Market Commentary: Russell 2000 Breakdown

Image
Sellers brought with them volume, but only the Russell 2000 finished the day with a breakdown. The Russell 2000 is trading within a larger, and more significant consolidation, but today's break ends the July-September rally, or at least broadens it. The presence of key moving averages offers additional support to work with, first of which is today's test of the 50-day MA.

Archive

Show more