Posts

Daily Market Commentary: Minor Losses

Image
The indecisive finish for the S&P and Nasdaq worked in bulls favor as it didn't bring a follow through to yesterday's selling. The Nasdaq held on to 50-day MA support. Swing traders could look to play a break of today's intraday range.

Daily Market Commentary: Disappointing Afternoon Fade

Image
Yesterday was a bit of reverse from my expectations. Had I seen a gap down with a 2-hour sell off, followed by a steady recovery to the (same) closing price, then I would have been much happier.  As it stands, there is a risk the selling could drift into today and keep buyers away until markets get closer to last Thursday's lows. Having said that, it does look like Thursday's lows will mark a strong support level. The profit taking which took markets down did knock breadth metrics down near, but not quite at, oversold levels. The Nasdaq 100 perhaps offers the most natural support as marked by the rising channel.  The 20-day MA is providing some supply, and if the index was to reverse and undercut the channel then this 20-day MA will become a shorting zone. The nearby presence of the 50-day MA complicates this a little as it has held as support (in conjunction with channel support).

Daily Market Commentary: Small Cap Channel Breakout

Image
Bulls will not doubt have danced a little jig of joy on Friday's close, but as Thursday's selling ultimately proved, the lack of volume will place a big asterisk next to it.  That's not to say there aren't areas of importance to watch. The Nasdaq has set up a defense line which will offer bulls a place for stops: a loss of 4,320 (on a close basis) would kill the nascent swing low in development. Stochastics haven't converged at oversold levels, so there may yet be a small bounce back to the 20-day MA before another push lower. Even so, buyers probably have more to gain from here forwards.

Daily Market Commentary: Tug of War Continues

Image
It has been a struggle between bulls and bears for the past week; each day alternating between buyers and sellers. Today belonged to sellers. Volume was lighter than yesterday, marking a lack of conviction on the part of sellers to drive the market lower. The index best positioned to bounce on Friday is the Dow. It finished the day very near the 200-day MA, offering a natural entry point for buyers. The Nasdaq was rebuffed at support-now-resistance and currently has a target of 4,245 and/or the 200-day MA.  Stops/Risk measured on a close above 4,380. The Russell 2000 was rebuffed from newly drawn channel resistance. Lower prices with a May low retest looks probable. Finally, the Nasdaq 100 is another index trading close to channel support and the 50-day MA. It's another good long candidate for Friday. For Friday, look for long opportunities in the Dow and Nasdaq 100. A weak open should look for short opportunities in the Russell 2000 while the downward channel

Daily Market Commentary: No Bearish Follow Through

Image
There is still a net decline in lead markets, but the crash-and-burn style headlines have yet to crack the resolve of bulls. The Nasdaq 100 found support at its 50-day MA, which itself is just above channel support. As the index is outperforming the others it's the one most attractive for bulls looking at the 'easy play'; stops on a close below channel support.

Daily Market Commentary: Buyers Not Ready Yet

Image
Monday's rally was brief and didn't trigger any follow through. Sellers pounced, hitting Large Caps hard, but leaving no index unscathed. Volume climbed to register distribution for the S&P, posting a new low for the July/August decline and came close to a potential new closing low. The 1,900 level is looking like the next stop down: watch for an intraday tag as this could be a good day trade on the bounce.

Daily Market Commentary: Sellers Continue to Press

Image
In previous sell offs, buyers have quickly come to the fore to buy-the-dip. They weren't so encouraged on Friday with buyers struggling to meet the supply created by sellers. Buyers still have a chance to strike with available support, although the amount of risk required to take such a position has widened. The indices closest to support, like the Nasdaq, finished with an opportunity at converged July swing lows and 50-day MA. A loss of the Friday low is the place for stops, although there is a good chance this low could be taken out on (probable) Monday (morning) weakness.

Daily Market Commentary: Bear Blitz

Image
Whatever tentative bullish plays were available before the start of the day were quickly put to rest by the close of business.  Where I thought the Dow might offer shorts the most reward, it was the Russell 2000 which suffered most. The Dow actually managed to close on a support level - although it probably doesn't look like it.

Daily Market Commentary: Mixed Action

Image
Bears got the volume, but not the action to suggest they succeeded in breaking bulls morale. The S&P continued with the channel breakdown, but finished with an indecisive 'spinning top'. Even if bears were to press tomorrow, the 50-day MA would quickly come into range as support. I suspect we are looking at a trading range, something part of a larger move higher.  However, it remains to be seen where the low of this range lies.

Daily Market Commentary: Bears Return

Image
The day started well (for bulls) with some early follow through upside, but it wasn't long until bears were trying their hand again. The S&P may have registered a channel breakdown. There was a close below channel support, although the day's low did not violate the low from yesterday. There was a marked rise in volume, confirming distribution.

Daily Market Commentary: Bulls Stage Afternoon Recovery

Image
Morning action left the Russell 2000 staring at a new swing low, and the S&P at a channel break. However, buyers returned in the afternoon to return the S&P to support and the Russell 2000 scrambling back to its 200-day MA.  Meanwhile, the Semiconductor index finished with a bullish doji on the 50-day MA. Given bears failure, bulls have an opportunity to press their advantage in the Semiconductor Index and S&P. The 608 low in the Semiconductor Index may see a test and perhaps an intraday violation, but there is a fairly decent long side opportunity available, if the 50-day MA can hold.

Daily Market Commentary: Bears Flash Intentions

Image
Bears made further inroads to the Semiconductor index, and Russell 2000, which delivered knock on results elsewhere.  The Semiconductor index had the worst of the action, slicing through its 50-day MA with a near 2% loss. If bulls wanted value a quick return above the 50-day MA would set up a 'bear trap' and may generate enough juice for a challenge of 650.

Daily Market Commentary: Market Pause

Image
Other than a slight uptick in volume for the S&P, it was a relatively quiet day. The one index which hinted at a change was the semiconductor index.  It had been trading in a sideways range which had drifted outside of its narrow, rising channel, but yesterday's close positioned it as a break of support. The 50-day MA is nearby to provide support, but with technical weakness expanding there is a strong possibility for a larger move down.

Daily Market Commentary: Watch Expanding Bearish Breadth

Image
While the S&P and Nasdaq have recovered strongly, supporting breadth for these indices hasn't been so glowing. For example, the Nasdaq is on the verge of a move to a new high, sitting just below the July peak, on a second day of accumulation.

Vacation Time: July 4th => July 22nd

Image
No posts for the next couple of weeks. Trading volume was light with tight action in Large Caps, but a little give in Small Caps. Existing trends in play until proven otherwise, anything else risks overplaying background noise. Pointers to keep an eye out for over the coming weeks: S&P remains on course to tag the 10% 200-day MA envelope (grey dashed line). Channel and/or 20-day MA support may offer pullback opportunities.

Daily Market Commentary: Vacation Trading

Image
Not much to write about. The S&P did nothing more but offer swing traders a nice narrow intraday range to trade against.

Daily Market Commentary: Nasdaq Breakout II

Image
There was only one index at the races on Friday. Strong volume action, and the close above 'Head' resistance, suggests the Nasdaq breakout has finally taken. The 'Bull Trap' hasn't totally been negated, but Friday's action was a big dent in it.

Daily Market Commentary: Bull Comeback

Image
Well, that selling didn't last long. Buyers didn't even wait for tests of nearby moving averages before buying - they just jumped in from the open and didn't look back. The Nasdaq may have done enough to trigger a breakout, although the spike high at 4,399 has the potential to play as resistance.  Given the way the MACD is going, I suspect we are going to get a 'sell' trigger here. This is not to day bulls can't keep this going, but I think there needs to be a greater shake of weak hands from their positions to get a break of 4,400 to hold.

Daily Market Commentary: Distribution and Possible Bull Trap in Nasdaq

Image
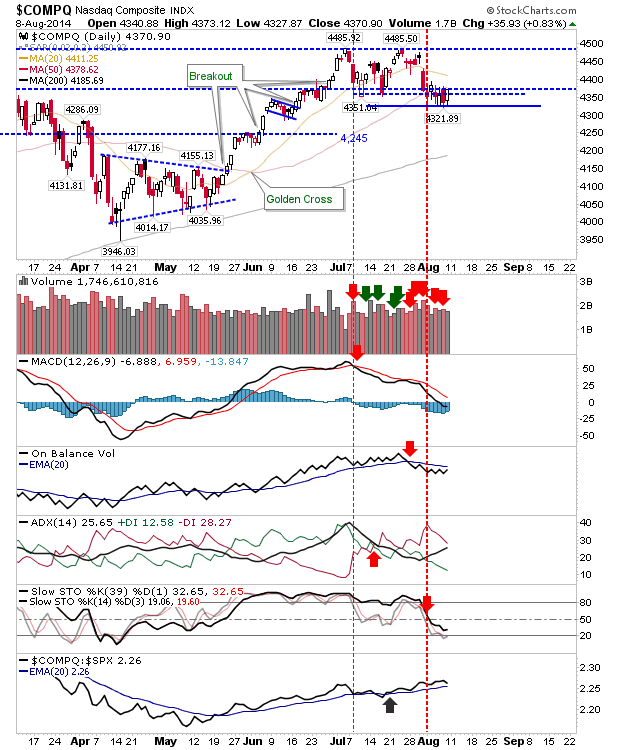
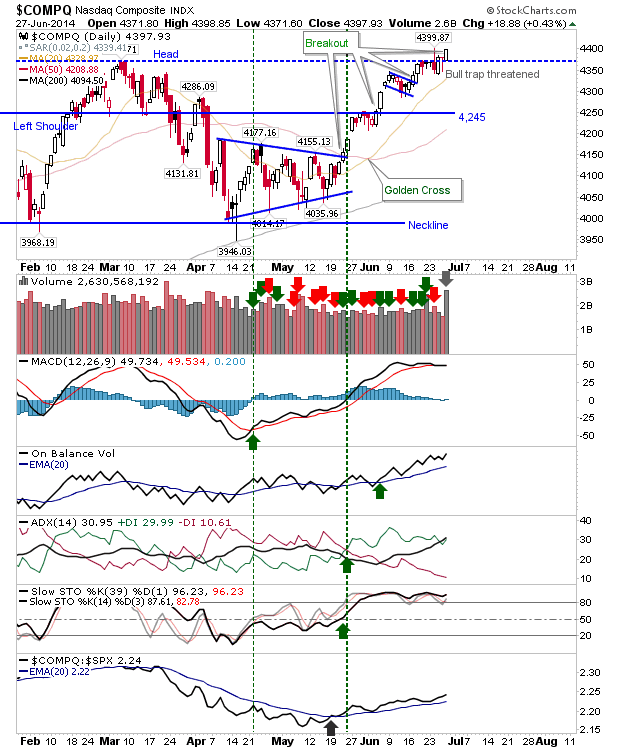
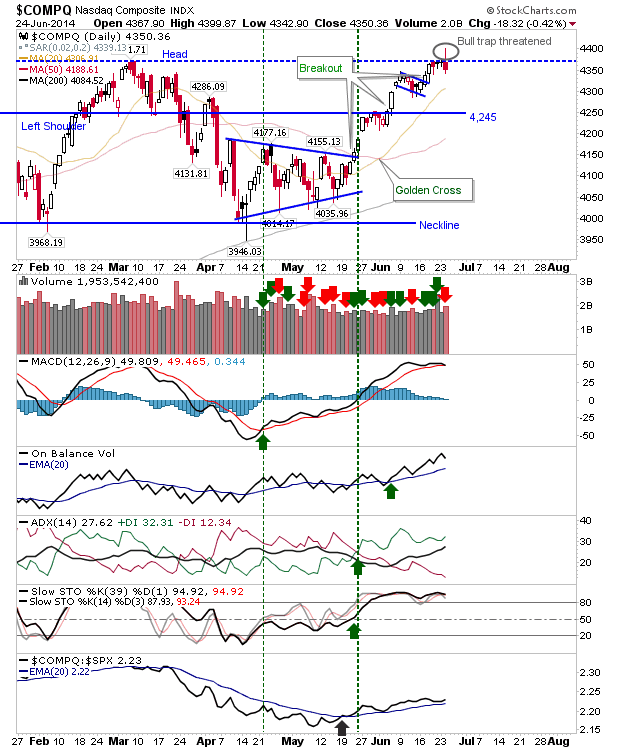
Sellers had to return at some point, and Tuesday was the day they paid a visit. I was too consumed with Suarez's fine dining skills to do an update last night, but given the day ranked as a distribution day it's worth passing comment. The most important action was found in the Nasdaq.  The index had looked to comfortably break past resistance, only to see it finish below this resistance. A classic 'bull trap' requires a close above, then below resistance, but Tuesday's action was more a plain rejection of the breakout level as a support zone.  The 'inverted hammer' on overbought short and intermediate term stochastics is a possible short entry with a break of 4,342 and an initial stop above 4,400. If going short, look to move the stop to around 4,369 on the first close below 4,342.

Sectorbreadth Analysis: Utilities and Energy Leading

Image
The summer rally has proven to be a boon for Energy and Utility stocks. According to my #sectorbreadth analysis, both Utilities ($XLU) and Energy ($XLE) are in covered call 'sell' territory, with Momentum, Trend and Volume indicators all above 90% bullish territory.  The September $44 strike call for $XLU traded at $0.65, and the September $102 strike call for $XLE at $2.20. The only sector cut from the pack is Consumer Discretionary ($XLY). While not in strong buy territory (I like to see all my breadth indicators below 10% for that), it may offer itself as a bargain bin opportunity for the summer on rotation out of overheated Energy and Utility stocks. You can access the interactive  sectorbreadth chart here .

Archive

Show more