Posts

Daily Market Commentary: Vacation Trading

Image
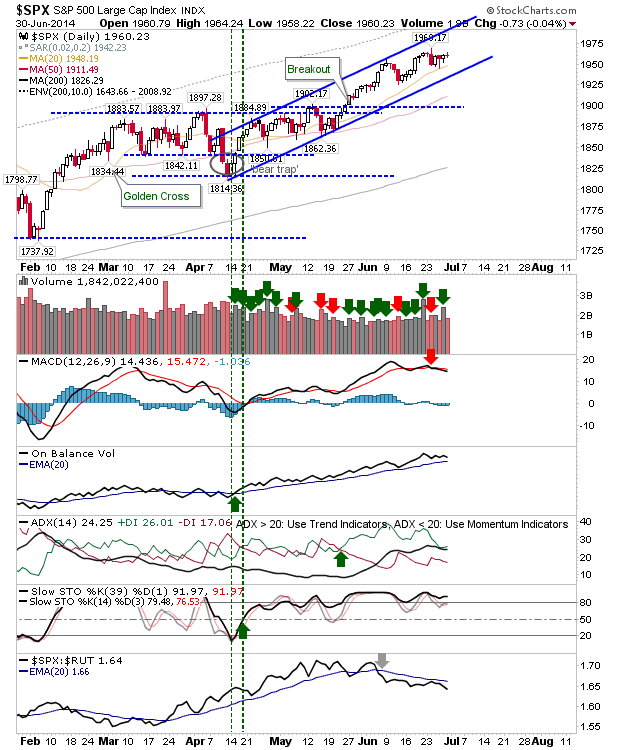
Not much to write about. The S&P did nothing more but offer swing traders a nice narrow intraday range to trade against.

Daily Market Commentary: Nasdaq Breakout II

Image
There was only one index at the races on Friday. Strong volume action, and the close above 'Head' resistance, suggests the Nasdaq breakout has finally taken. The 'Bull Trap' hasn't totally been negated, but Friday's action was a big dent in it.

Daily Market Commentary: Bull Comeback

Image
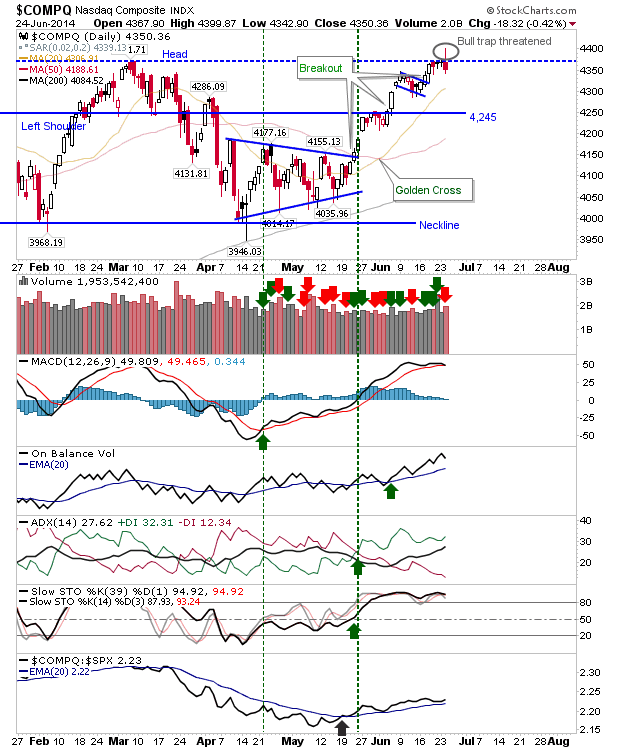
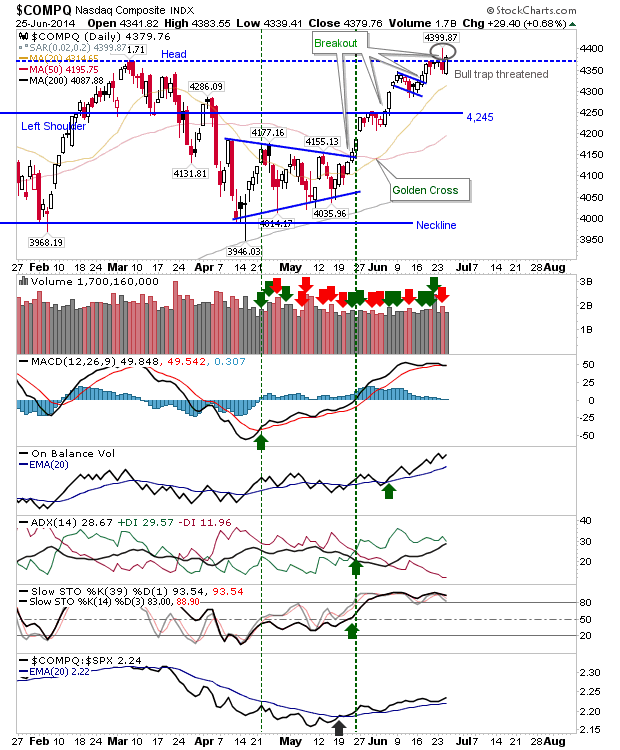
Well, that selling didn't last long. Buyers didn't even wait for tests of nearby moving averages before buying - they just jumped in from the open and didn't look back. The Nasdaq may have done enough to trigger a breakout, although the spike high at 4,399 has the potential to play as resistance.  Given the way the MACD is going, I suspect we are going to get a 'sell' trigger here. This is not to day bulls can't keep this going, but I think there needs to be a greater shake of weak hands from their positions to get a break of 4,400 to hold.

Daily Market Commentary: Distribution and Possible Bull Trap in Nasdaq

Image
Sellers had to return at some point, and Tuesday was the day they paid a visit. I was too consumed with Suarez's fine dining skills to do an update last night, but given the day ranked as a distribution day it's worth passing comment. The most important action was found in the Nasdaq.  The index had looked to comfortably break past resistance, only to see it finish below this resistance. A classic 'bull trap' requires a close above, then below resistance, but Tuesday's action was more a plain rejection of the breakout level as a support zone.  The 'inverted hammer' on overbought short and intermediate term stochastics is a possible short entry with a break of 4,342 and an initial stop above 4,400. If going short, look to move the stop to around 4,369 on the first close below 4,342.
Sectorbreadth Analysis: Utilities and Energy Leading

Image
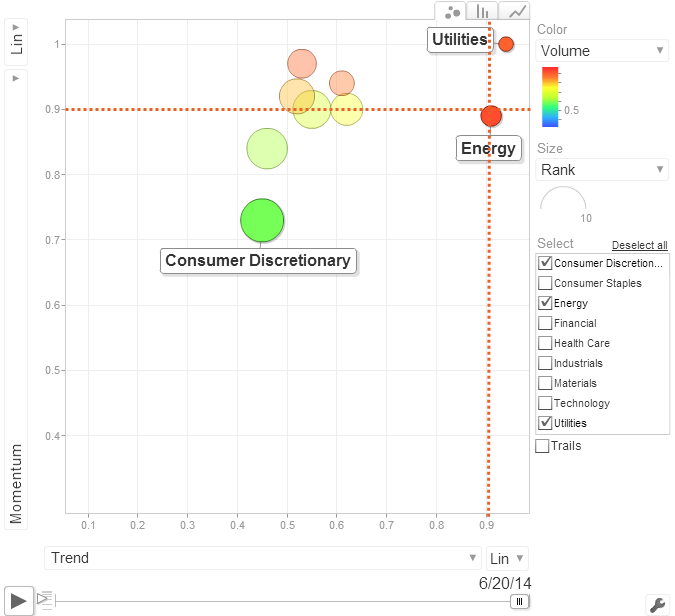
The summer rally has proven to be a boon for Energy and Utility stocks. According to my #sectorbreadth analysis, both Utilities ($XLU) and Energy ($XLE) are in covered call 'sell' territory, with Momentum, Trend and Volume indicators all above 90% bullish territory.  The September $44 strike call for $XLU traded at $0.65, and the September $102 strike call for $XLE at $2.20. The only sector cut from the pack is Consumer Discretionary ($XLY). While not in strong buy territory (I like to see all my breadth indicators below 10% for that), it may offer itself as a bargain bin opportunity for the summer on rotation out of overheated Energy and Utility stocks. You can access the interactive  sectorbreadth chart here .

Daily Market Commentary: Still Waiting on Nasdaq Breakout

Image
Ditto the weekend's comments. Some very tight action didn't change the outlook, although this narrowing of the intraday range will increase the reaction response when it breaks. The Nasdaq is either going to break out big or fall hard down; the breakout is looking more likely. A hard fall wouldn't last long as buyers would step in at 20-day MA and 4,245 support.

Daily Market Commentary: Watch for Nasdaq Breakout

Image
Lots of buying volume on Friday, although only small gains to match. The Nasdaq is best poised to advance on Monday given it lies just shy of resistance. The narrow range day also offers itself as a swing trade opportunity (with a stop on the flip side).  Trend direction suggests this will push higher, becoming a nail in the coffin to what had looked like a (complex) bearish head-and-shoulder reversal.

Daily Market Commentary: Bullish Accumulation

Image
Bulls do it again with higher volume accumulation follow through.  The S&P finished at a new high as it works its way towards the 10% envelope I define as covered call sell territory.

Daily Market Commentary: Contained Rally

Image
Disappointing action after bulls attempted to build on Friday's stall in the decline. The Russell 2000 had the best of the action as it suggested a breakout from the bullish flag.  Bulls could look to buy with a stop on a loss of Friday's low. The next challenge is to clear declining resistance connecting March and June swing highs.

Daily Market Commentary: Low Volume Stall

Image
Bulls didn't want to offer bears any confidence and Friday's low volume (small) gain was enough to keep them away. Optimist bulls could say Friday finished with bullish inside days/bullish doji - but such patterns only have merit in oversold markets, and this is not an oversold market. However, there are plenty of long term bulls (me included) who have limited skin in the game and are looking at opportunities to get in. I'm waiting for a 10% discount on the 200-day MA, but others won't be so patient and may look to nibble on Monday. For the S&P, the 20-day MA is fast approaching the market even if the S&P is dawdling down to the MA. The S&P may kick on once the 20-day MA is tested.

Daily Market Commentary: Destined For Push Back to 20-day MAs?

Image
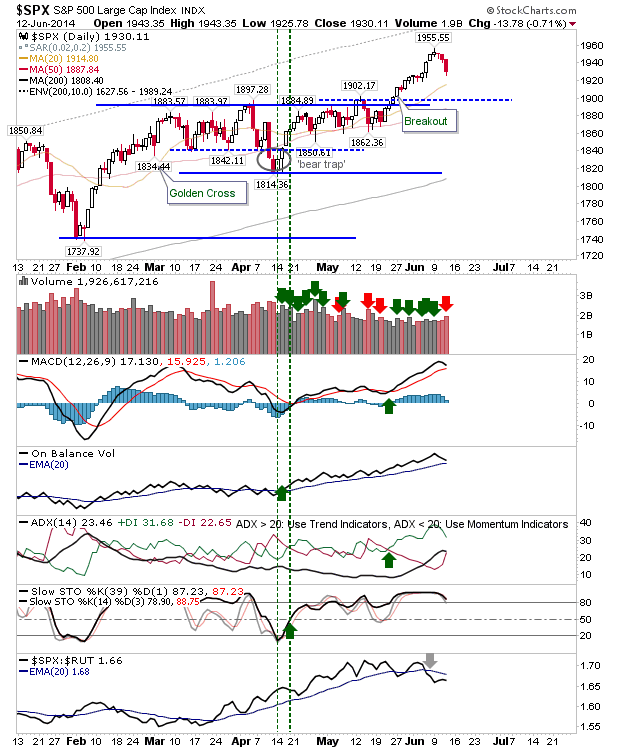
The 2nd/3rd day of declines has been relatively orderly so far. Volume picked up in distribution as many traders took easy profits from either the May breakout, or from positions taken during the earlier dip in January/February. A move back to 20-day MAs would be substantial enough to attract buyers back, and yet maintain the strong bullish momentum which has been a characteristic of the summer breakout. Even if there was a loss of the 20-day MA in the S&P there would be additional support to be found from the May breakout level.

Daily Market Commentary: Light Losses

Image
Stockcharts data may be back, but there wasn't much to miss. Indices finally got a down day, but it was nothing to suggest it was anything more than the start of a consolidation.  Today's action was welcome, probably by both sides.  Overall low volume losses in the S&P could also be viewed as distribution at a pinch, but best to stick with the low volume thesis.

Daily Market Commentary: Stockcharts Feed Fail

Unfortunately, stockcharts had a data feed failure, so no update for today.  But going on Yahoo data, morning weakness was bid up by the close, to leave indices more or less where they started. The morning buying again points to demand buying on any sniff of weakness. --- All Contributions Welcome - Thank You! Follow Me on Twitter Dr. Declan Fallon is the Senior Market Technician and Community Director for Zignals.com . You can read what others are saying about Zignals on Investimonials.com . JOIN ZIGNALS TODAY - IT'S FREE!

Daily Market Commentary: Bulls Chug Along

Image
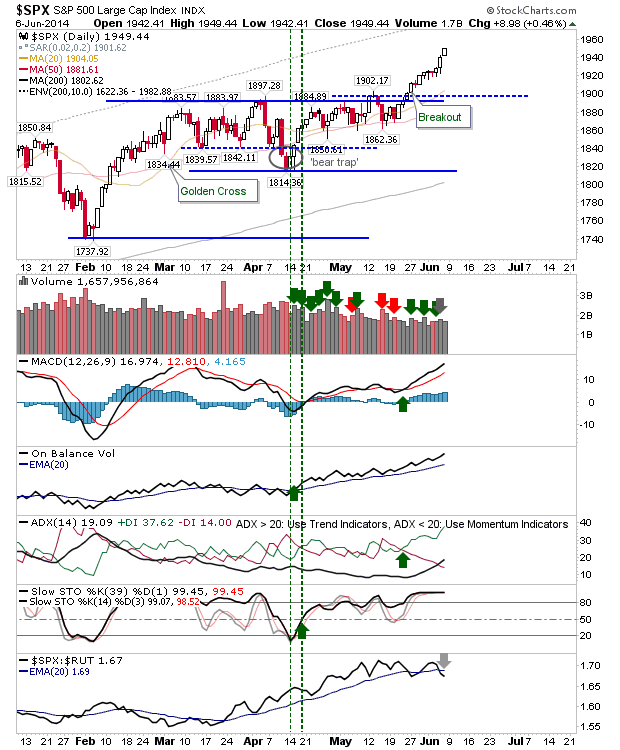
The advance in the S&P looks like it has the legs to make it to the upper envelope band, which marks a 10% gain on the 200-day MA, and a good place to sell covered calls.  Even if sellers were to make an appearance it would require large chunks of change to disappear in the space of a couple of days to shake what are stubborn shareholders out of their positions.

Daily Market Commentary: Shorts Can't Bear To Look

Image
Each day has become another twist of the screw for bears and shorts. While it may be hard to be a buyer at these levels, it's even more difficult to be a short. The S&P added nearly half a percent on light volume; technicals remaining firm.

Daily Market Commentary: Shorts Crushed

Image
A tough day for any shorts in the market. The Nasdaq blew away the right shoulder of the bearish head-and-shoulder pattern. It hasn't completely negated the pattern - a break of the head high is required for this - but it's a big step in the right direction. Volume climbed to register accumulation as the index continued to gain in relative performance against the S&P.

Does This Look Like An S&P Top?

Image
Nope... Hat-tip to NasTrading Run this from the start here: http://stockcharts.com/freecharts/yieldcurve.php All Contributions Welcome - Thank You! Follow Me on Twitter Dr. Declan Fallon is the Senior Market Technician and Community Director for Zignals.com . You can read what others are saying about Zignals on Investimonials.com . JOIN ZIGNALS TODAY - IT'S FREE!

Daily Market Commentary: Bulls Take Over

Image
Yesterday was a quiet day for indices, but there was no doubts who took control today. The semiconductor index maintained its bullish form with another good day of gains. The semiconductor breakout has performed very well after a successful second attempt. A series of bearish days would be welcome to consolidate the advance.

Daily Market Commentary: Quiet Day For Markets, But Big Day For Semiconductors

Image
No shocks to the system in what amounted to a quiet day for the indices. The real winner was the semiconductor index, it added nearly 1% as it posted a new 52-week high. This strength should filter down to the Nasdaq and Nasdaq 100, although today was quiet for the latter indices.  The measured move target for the semiconductor index is 650.

Daily Market Commentary: Bulls Keep Things Ticking Over

Image
No great surprises or shocks from Friday, a late surge in the S&P gave the end result to bulls, but losses elsewhere were very minor. Another day which keeps the bullish picture intact: very little on offer for bears. In the case of the S&P the strong finish on the day came with higher volume accumulation. There was a brief recovery in relative strength (vs Russell 2000), although it looks like a temporary reprieve.

Archive

Show more