Posts

Showing posts with the label Options

JAKKS Pacific

Image
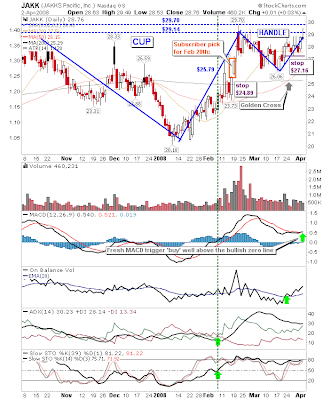
JAKKS Pacific ( JAKK ) was a featured newsletter pick for February 20th [ $ ] . The stock since shaped a solid looking cup-and-handle pattern with rising accumulation on the back of a fresh MACD trigger 'buy' (well above the bullish zero line). The original stop of $24.89 can be raised to about $27.16, although those looking to allow a little more room can allow for a stop just below the lows of the handle at $26. The push to $29 was enough to trigger a Triple Top Breakout on February 21st in the point-n-figure chart which reversed the previously bearish target of $13 to the bullish $46. A projected base target is closer to $42. On the Options side, January 09 $15 strikes trade from $14.80 from the Ask, although there is not much in the way of open interest. Trade my Stock Picks at

Tech watch

Image
With the indices struggling to break through their 20-day MAs, let alone the 50-day MAs, there are signs of a recovery in some leading Tech stocks . Sample list: GOOG , AAPL , CSCO , BIDU , MSFT , INTC , ORCL , AMAT , TXN , HPQ Stocks above 20-day MA ( 80% ): Apple ( AAPL ), Cisco ( CSCO ), Baidu ( BIDU ), Microsoft ( MSFT ), Intel ( INTC ), Oracle ( ORCL ), Applied Material ( AMAT ), Hewlett Packard ( HPQ ) Stocks above 50-day MA ( 40% ): Cisco ( CSCO ), Intel ( INTC ), Applied Materials ( AMAT ), Hewlett-Packard ( HPQ ) Stocks with a 20-day MA > 50-day MA ( 20% ): Applied Materials ( AMAT ), Hewlett-Packard ( HPQ ) Not the worst spread of strength for a weak market. Of the two intermediate bull trenders ( AMAT and HPQ ), Applied Materials ( AMAT ) has the best outlook going forward. Hewlett-Packard is struggling to hold its 200-day MA/40-week MA after 3 years of strength, so I would can this as a long side play (or maybe consider a January $70 2010 put going for $23.60 from the a

Coeur D Alene Mines (CDE)

Image
Coeur D Alene Mines ( CDE ) had initially featured as a blog stock pick for December of last year. The Technical picture has improved considerably, although the gold miners have not enjoyed the same exponential growth as seen in base metal prices (this is bearish for the base metal as stocks lead commodities with respect to performance). Given there is a reasonable chance of a breakout failure one could use Monday's move as an opportunity to raise the stop for the December 'Buy'. The point-n-figure chart has a new price target of $9.25 from the December 17th target of $7.75. The chart is nicely set for a triple top breakout if it can make it to $5.50 (an additional 'Buy' trigger). On the options front the January 2009 $2.50 calls currently trade at $2.90 from the ask (up $0.85 from December), with the $5.00 calls at $1.20 (up $0.30 from December). Monday's gains came courtesy of earnings . Trade my Stock Picks at

Buyers range established

Image
The last two days have seen tweezer bottoms in large cap indices, a bullish piercing pattern in the Nasdaq 100 , and a (somewhat) bullish engulfing pattern in the Nasdaq . But my favorite, the semicondutor index , refused to buckle in the face of broad market selling over the last week - although it would be hard pushed to shed more than it has already. Wednesday's bullish hammer is the icing on the cake. Watch for a fresh MACD trigger 'buy' (but well below the bullish zero line, a weak signal) as other technicals improve: The Semiconductor index has a Point-n-Figure chart target of 260 (which would amount to a 50%+ decline from its 2007 highs!). To negate this target the index would need to muster an upside breakout, with 364 likely to define such a threshold. The technology sector is one of the first to push higher from a recessionary environment. Chips should lead other technology based sectors. For the purpose of disclosure I am long some deep-in-the-money calls on the

Cosan (CZZ)

Image
This featured as a member [$] pick last week. The stock continues to provide solid bullish action with Thursday's and Friday's action confirming $13.36 as support. The original stop from $12.79 can be raised to around $13.29. As a 2007 IPO the stock has no overhead resistance, so it is well placed to move higher from here. The stock has listed options , but not the liquidity to make them worthwhile.

Gap (GPS)

Image
Maybe not the first name to jump out of box, but this old dog (it has been caught in a trading range since 2004) might be about to learn a new trick. The chart shows a steadily rising price trend helped by the recent 'Golden Cross' between the 200-day and 50-day MAs. The past two days have seen some demand at the 200-day MA as indicated by the long, lower tail candlestick shadows - one of which also finished as a 'dragonfly doji'. Technicals are a bit of a mixed bag, but the accumulation trend in on-balance-volume is clear. There may be a concern with the break of the August-November trend, but using the 200-day MA or candlestick lows for stop placement will help define downward risk. Options ; short term traders will be looking to the 20-day MA as a target (currently at $20.80); but the $20 Jan strike at $0.50 from the ask looks expensive, with the $20 Feb strike at $0.90 only marginally better. Best short term play would be the $15 Jan strike at $4.50 ($0.15 time prem

Semiconductor bounce

Image
One of the most overlooked sector hammerings in recent months has come in the semiconductors. The semiconductor HOLDRs ( SMH ) have shed 26% from their July highs compared to 27% in the much hyped financials. Yesterday's late afternoon challenge by the bulls in the broader market should see some initial good will Tuesday morning ( Futures are up a tad). This could provide a longside opportunity in the SMH. The 60-min intraday chart shows a decent capitulation following the gap from $30.75, with prices stabilizing in $29.25-29.75 range. The coming week could see a nice counter rally opportunity back to gap at $30.75, with the potential for follow through (based on the health of the broader indices) to the 62% Fib retracement at $31.75. The initial risk is about $0.50, but this could be reduced to around $0.25-0.30 if one got a fill at $29.25. On the option front; $22.50 February 16th calls at $7.10 from the Ask give relatively low downside risk with enough time built in for the b

E*Trade (ETFC)

Image
There is no question as to the trend E*Trade ( ETFC ) has 'enjoyed' for the past few months. And with the avalanche in full flow there would be little desire to want to jump into the snow and play, but the stock must be near an attractive price for a takeover bid from the likes of T.D. Ameritrade. If there was a takeover interest it probably would be the interest of the buyer to make an offer sooner rather than later, to at least stem the flow of brokerage (its key asset) cancellations/transfers which is no doubt underfoot. From a technical perspective the stock lost $3.69 support on Thursday to end with a $3.37 close. Supporting technicals remain bleak, but the real interest here is less on the short term and more on what the future might bring. If the stock was to receive a buyers bid I suspect it would be over the next 12 months (certainly the stock price couldn't last another 12 months shedding as much as it has). This makes the January 2009 $2.50 strike call at $1.9

Fuel Cell Energy (FCEL)

Image
One of the few bright spots over the past few days has been Fuel Cell Energy (FCEL). The stock made a strong volume, gap breakout, on the back of earnings . The gap failed to fill on the backtest of support, in itself a bullish confirmation signal. Wednesday's follow through came on slightly disappointing volume, likely an artifact of holiday trading. I wouldn't be surprised to see it drift into the $11.50-12.00 range before pushing higher. You can get a 15-min delayed data chart for FCEL here ; if you like the chart please give it your Vote at the bottom of the chart - TY. On the options front, July 2008 $5 strike Calls were showing the same ask ($7.60) as April's 2008; that's a measly $0.26 time premium for a stock which has added $4 in a month. Good value.

Coeur D Alene Mines (CDE)

Image
A review of some of the Gold stocks I follow saw an interesting opportunity in Couer D Alene Mines Corp ( CDE ). There is a strong confluence of support marked by the 50-day MA, and the lows of the large white candlestick from early November, created by a Bear Stearns analyst comment that the stock was underpriced , helped later by JP Morgan's upgrade . Given the stock is trading near the price prior to these announcements should be of interest to buyers. Earlier tests of the 50-day MA since October have seen buyers step in - so now shouldn't be any different. The Base metal is making a similar test of its 50-day MA support. The "Golden Cross" between the 50-day and 200-day MAs is a long term bullish signal. Technicals could be better; a mild distribution trend in on-balance-volume isn't helped by the scrappy action in the MACD, or Directional Index. But at least the MACD is holding above its bullish zero line. The point-n-figure has an interesting chart showi

MicroStrategy, MSTR

Image
MicroStrategy ( MSTR ) was drawn from a new short scan I am developing. Friday saw a combination break of support, with a nicked loss of 50-day and 200-day MAs. The latter may be enough to generate a swell of buying back to the 20-day MA - an alternative entry point. A loose stop is marked at $105.11, but a tighter one could be placed around $102.62 (just above the 20-day MA). Downside targets are the 2 breakout gaps and August support at $61.00. Technicals have aligned in support of weakness with a fresh 'sell' in on-balance-volume - marking a shift to distribution, combined with a bearish crossover in trend strength (-DI > +DI). Deep in the money puts for April 2008 can be bought with little time value; Optionetics shows the ask for a $150 strike Put at $55.20, with good value for $120 strike puts for the same expiration at $27.50, and the $125 strike at $31.70.

Archive

Show more