Weekly Market Commentary: Odd Divergences
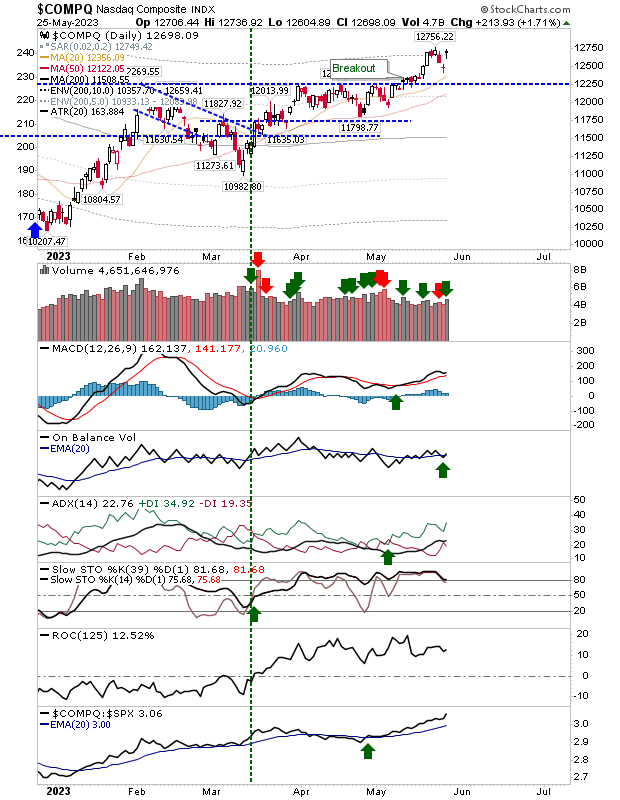
The shortened trading week brought up some odd behavior in some of the indices. The Nasdaq lost a couple of percent on the week but long term stochastics [39,1] actually gained. However, the MACD histogram played to form and continued to (negatively) diverge from its high. The break of 1,759 resistance in the index held.

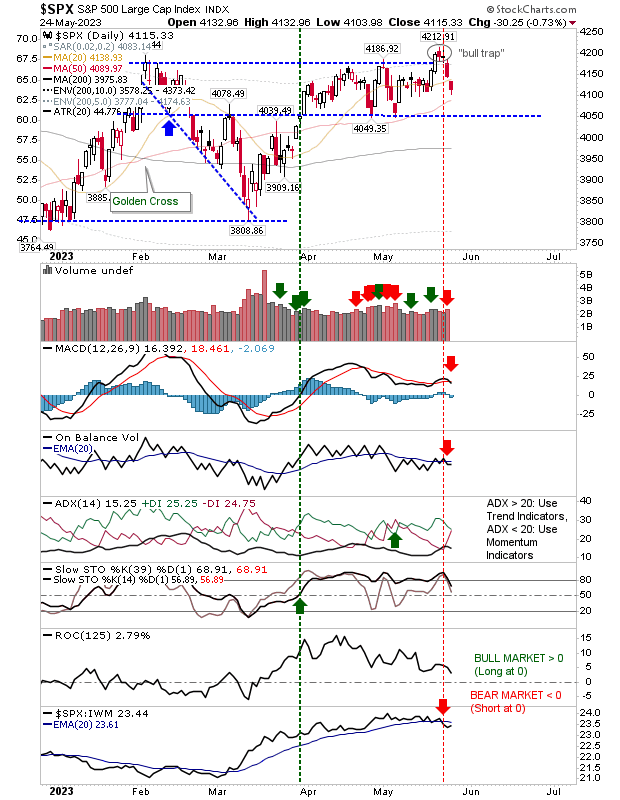
Long term stochastics [39,1] for the S&P stayed hemmed in by resistance at the mid-line; the head-and-shoulder return down to 800s looks the most likely projection, but even this target feels too obvious.

The Nasdaq 100 had pushed the highest of the indices over the past few weeks, trading around 2006 reaction lows - but this microbreakout is under threat even if longterm stochastics [39,1] gained.

Market Breadth showed a confirmed technical sell in the Percentage of Nasdaq stocks above the 50-day MA:

The S&P displayed confirmed breadth 'sell' trigger in the Bullish Percents:

To follow the June 'Sell' signal

Shorts will be building in confidence...
Dr. Declan Fallon, Senior Market Technician, Zignals.com the free stock alerts, stock charts, watchlist, multi-currency portfolio manager and strategy builder website. Forex data available too.