Nasdaq stalls as it seeks support
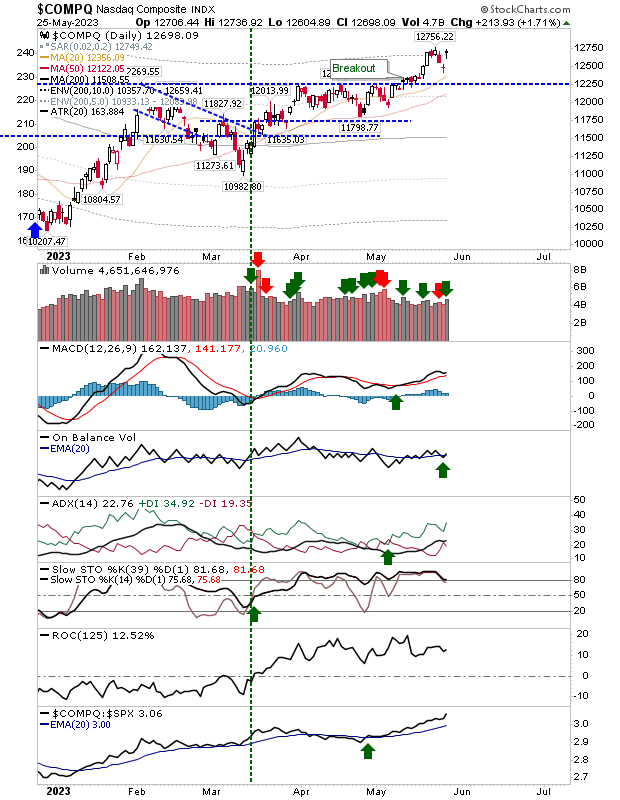
The Nasdaq ran into and reversed from a declining resistance line created by the reaction peaks in August and September; previous resistance lines from September-October and September-November have been breached so this looks to be another step towards a continuation of the "Santa Rally".

Yesterday's wedge breakout cut back below the resistance line and is now looking at the 20-day/50-day MAs for support (on a closing basis)

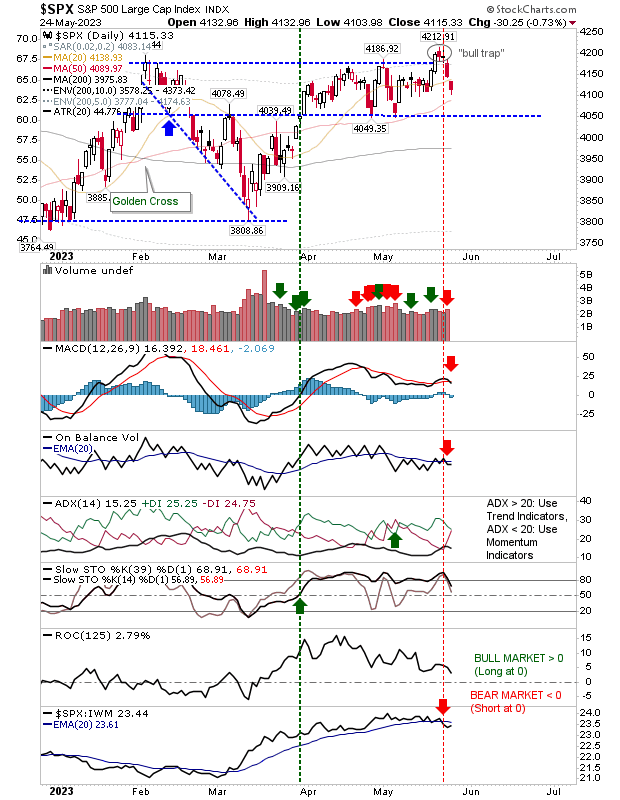
The picture in the S&P is similar; again, note the disparity in peaks between the Percentage of Stocks above their 50-day and 200-day MAs for May and January - how will this map out with respect to the market?

My expectations are for markets to find support (by closing prices) at the 50-day MAs. Rally is mature for a bear market but it's not dead yet.
Dr. Declan Fallon, Senior Market Technician, Zignals.com the free stock alerts, market alerts and stock charts website
Yesterday's wedge breakout cut back below the resistance line and is now looking at the 20-day/50-day MAs for support (on a closing basis)
The picture in the S&P is similar; again, note the disparity in peaks between the Percentage of Stocks above their 50-day and 200-day MAs for May and January - how will this map out with respect to the market?
My expectations are for markets to find support (by closing prices) at the 50-day MAs. Rally is mature for a bear market but it's not dead yet.
Dr. Declan Fallon, Senior Market Technician, Zignals.com the free stock alerts, market alerts and stock charts website


