Stockcharts.com: Weekly review
The real mover on the week was the semiconductor index. What had the stockcharters got to say about the week's action.
As a starter, Richard Crockett's list of breakout stocks is the number 1 ranked list according to hits - 37,543 to date and jumps all the "Hall of Fame" authors (Ignore the Vote count - foot traffic speaks louder than click traffic - Chip Anderson are you listening!). His first page has a number of interesting stocks; take a look at Barrick Gold Corp (ABX) and Abbott Laboratories (ABT) as examples.


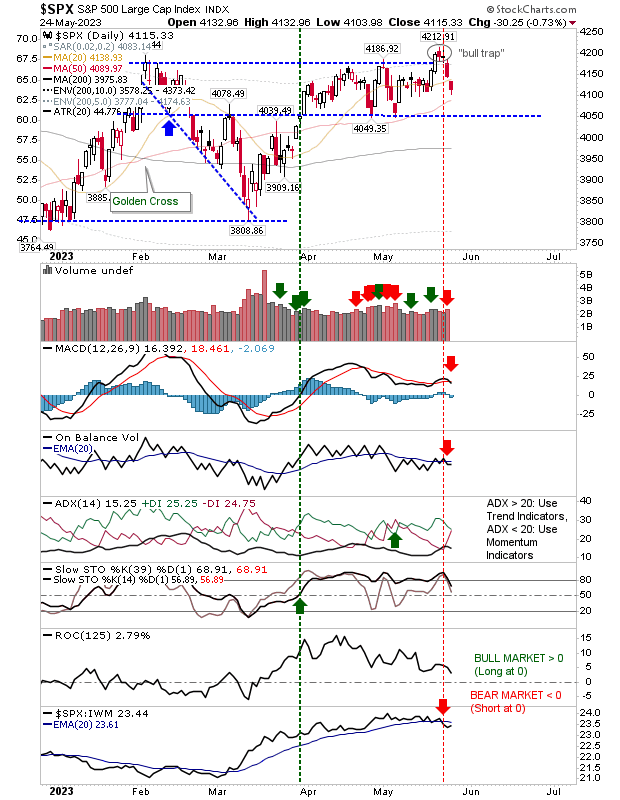
Joe Reed has gone for a 'top' in the S&P with a 'sell' trigger in full stochastics and the Wm%R indicator:

His next focus was GLD, although I don't remember seeing this chart during the actual 'buy' trigger - but it is a nice chart to repeat:

His other charts on energy and oil were much as he said before.
Mitchell Meana has been showing a Nasdaq 100, 18-day cycle chart. By his reckoning, Monday (or early next week) should see that start of the next correction:

I noticed he hasn't labelled the end of the fifth wave in the S&P - so I presume this means he expects it to go higher?

Although his NYSE Composite Index looks to have reached its fifth wave conclusion (unless it extends...):

His Russell 2000 (IWM) play reached its upside target:

Ted Burge was the first to show the gains in the semiconductor index. His chart shows a neat reversal off resistance (492) with support at 484 and various levels below:

The point-n-figure chart has a target of 528 for the SOX:

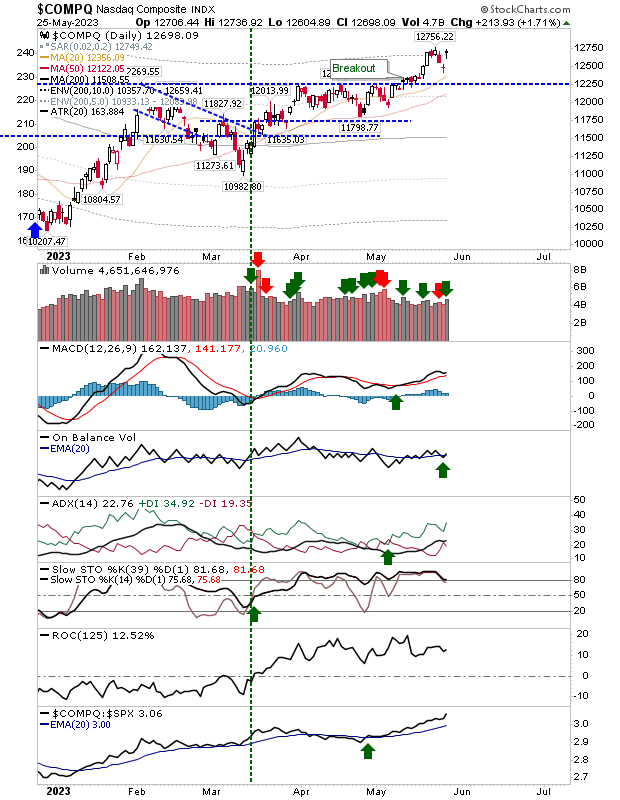
Matthew Frailey's first chart is interesting as it shows the break of the bearish divergences in the MACD and CMF for the Nasdaq - this should be considered bullish:

His front page charts also show the triangle breakout for silver:

and a chart for the semiconductor index which suggests former support from last July through to January is now firm resistance:

But the main area to watch is huge triangle resistance dating back to 2000. If the point-n-figure chart target plays out (i.e. a move to 528) then we will have a significant breakout on our hands (indeed - it looks like there is one already):

Matthew also shows how this same pattern plays for Intel (INTC):

Robert New is looking for 2,900 in the Nasdaq:

But is most interesting chart is the 10 Year Treasury Note Yield - he has a neat reverse head-and-shoulder pattern which should be very close to completing its right shoulder. This should translate as bad [corrected - thanks Jim for the spot] news for the market (and bond prices):

Maurice Walker had this to say about the markets:
Supported by his SMH chart:

His long term chart shows a tighter triangle in play:

I shall close with comments from Richard Lehman. His 5-min, 60-min and daily charts for the major indices are worth looking at:
Stockcharts.com
As a starter, Richard Crockett's list of breakout stocks is the number 1 ranked list according to hits - 37,543 to date and jumps all the "Hall of Fame" authors (Ignore the Vote count - foot traffic speaks louder than click traffic - Chip Anderson are you listening!). His first page has a number of interesting stocks; take a look at Barrick Gold Corp (ABX) and Abbott Laboratories (ABT) as examples.
Joe Reed has gone for a 'top' in the S&P with a 'sell' trigger in full stochastics and the Wm%R indicator:
His next focus was GLD, although I don't remember seeing this chart during the actual 'buy' trigger - but it is a nice chart to repeat:
His other charts on energy and oil were much as he said before.
Mitchell Meana has been showing a Nasdaq 100, 18-day cycle chart. By his reckoning, Monday (or early next week) should see that start of the next correction:
I noticed he hasn't labelled the end of the fifth wave in the S&P - so I presume this means he expects it to go higher?
Although his NYSE Composite Index looks to have reached its fifth wave conclusion (unless it extends...):
His Russell 2000 (IWM) play reached its upside target:
Ted Burge was the first to show the gains in the semiconductor index. His chart shows a neat reversal off resistance (492) with support at 484 and various levels below:
The point-n-figure chart has a target of 528 for the SOX:
Matthew Frailey's first chart is interesting as it shows the break of the bearish divergences in the MACD and CMF for the Nasdaq - this should be considered bullish:
His front page charts also show the triangle breakout for silver:
and a chart for the semiconductor index which suggests former support from last July through to January is now firm resistance:
But the main area to watch is huge triangle resistance dating back to 2000. If the point-n-figure chart target plays out (i.e. a move to 528) then we will have a significant breakout on our hands (indeed - it looks like there is one already):
Matthew also shows how this same pattern plays for Intel (INTC):
Robert New is looking for 2,900 in the Nasdaq:
But is most interesting chart is the 10 Year Treasury Note Yield - he has a neat reverse head-and-shoulder pattern which should be very close to completing its right shoulder. This should translate as bad [corrected - thanks Jim for the spot] news for the market (and bond prices):
Maurice Walker had this to say about the markets:
2/22 Commentary: The Semiconductors broke out today of their Symmetrical Triangle pattern on the daily chart (3rd chart directly below). The pattern measures 2.48 points and has a target of 37.08. We added several plays off the Sox last week that have done well. NSM broke out with todays move gaining over 7 percent.
The Nasdaq broke out of a Symmetrical Triangle 3 days ago and the Sox and SMH (Semi ETF) broke out a Symmetrical Triangle today. These are extremely bullish events that should allow the Nasdaq to take the path of least resistance, which is upward. The weekly SMH chart has a huge Symmetrical Triangle on it that has a breakout pivot point near 37. If that 4 year base breaks to the upside it measures 32 points. Which means that the semis could make a significant move over the next couple of years.
It is time to start watching the semis (SMH) again, now that they are making higher highs on the daily with todays breakout. We are now seeing an advancing 20 day MA on the SMH daily chart which is also very bullish. This index has been trading sideways for about the last 6 months and the big money has been made elsewhere like in the Midcaps, SP 500, and Transports. But I believe that the Sox and Nasdaq will now play catch up to the SP 500's recent move and begin to outperform. The internet index (pg 12) is forming a handle on its Symmetrical Triangle pattern and that should also help the Nasdaq. As we have been suggesting for a few weeks, the Sox/SMH will lead the Nasdaq forward to tag its Symmetrical Triangle target of 2609.
I believe that the Q's will rise and test the 51 dollar resistance level. The Spy could test resistance at 146.92 and then move to make new highs as long as support holds. Take a look at the 9 year weekly chart on the Spy and you will see what I mean (2nd chart below). The bulls continue to remain in power.
Supported by his SMH chart:
His long term chart shows a tighter triangle in play:
I shall close with comments from Richard Lehman. His 5-min, 60-min and daily charts for the major indices are worth looking at:
2/24 -- The Dow and the SPX are coming down to critical junctures in the next day or so. They have been in declining legs (minichannels) within their long running uptrends, but these legs are very predictably dropping to the lower support line of the upchannel -- a place from which strong bounces have occurred regularly now for months. There is always the possibility that this could be the time they break, but nothing indicates that yet. In fact, their patterns are strikingly similar to the last such occurrence which led to a nice rise on Feb 13th.
The Naz and QQQQ are actually in strongly rising minichannels within their short term uptrends, but have also dropped to the lower lines, setting up for a possible bounce soon as well.
So, despite the tendency to say things are due for a hefty correction, the next immediate move points upward right now. That said, the long term picture is still very toppy, and could begin that long awaited correction in the coming weeks or months, just not yet.
2/22 -- Several charts became more clear today and a number of lines were redrawn. The Dow is in a declining minichannel and is tracing out a pattern similar to the one in early Feb. The SPX, however, has still been in a rising minichannel. The Naz and Qs went above their upper channel lines, but their moves are more explainable when you view their minichannels. Whether they cause a new slope in their larger channels is uncertain. The XLE looks a lot more bullish in a new channel that has now emerged. The long term charts are hitting upper lines again and have fallen back each time that has recently happened.
Stockcharts.com