Stockcharts.com: Weekly review
I will lead off with Richard Lehman's work. He said it nicely here:


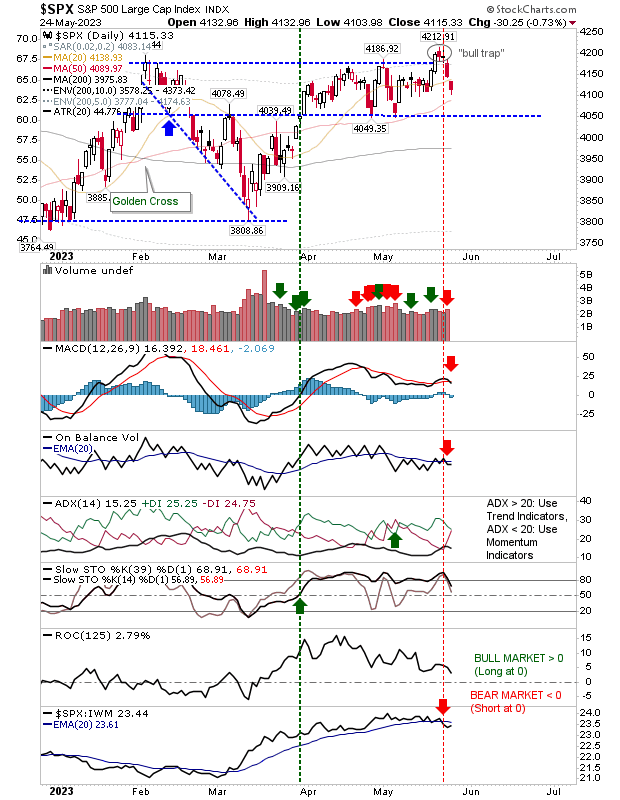
Joe Reed is looking for a top in the S$P:

Mitchell Meana has an interesting chart for the Dow Jones Wilshire 5000 Index. He is looking for an upward target of 14,519 to complete the last leg of the rally before the next A-B-C correction takes hold:

He hadn't changed his earlier opinion on the Q's and is looking for the fiftth wave to take it up to $46.29. The Q's finished last week at support and can't fall much further without jeopardizing the count:

Ted Burge sees things in a more bullish light:
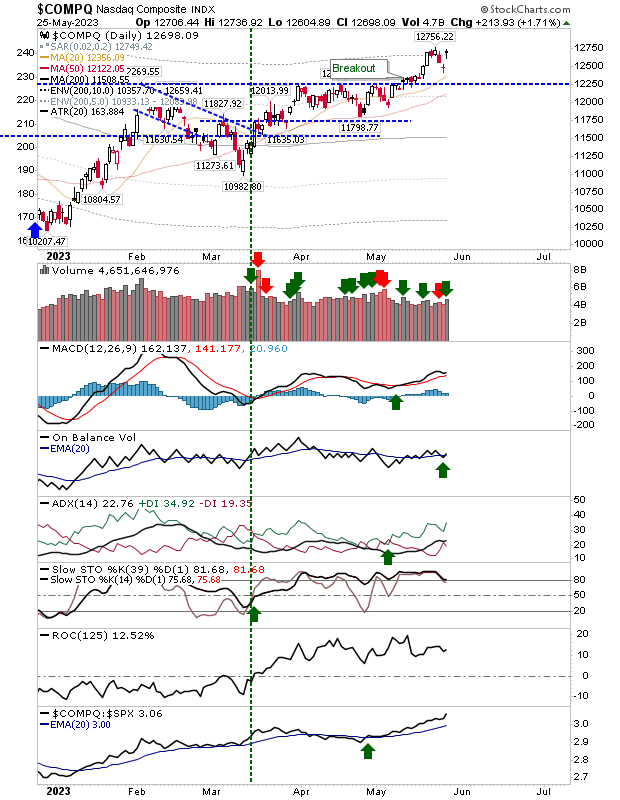
He highlighted the Nasdaq Composite Bullish Percent Index as an example of this strength:

Matthew Frailey is looking at a number of bullish triangles. One for the Dow Transports:

another in silver:

Robert New has continued with his negative divergences in all key indices:


But his semiconductor analysis is looking shady for the bulls:

So, in summary - if markets start to retreat off the open then Richard is likely to be on to something. If there is a push past Nov-Jan resistance, then Mitchell and Ted will be sitting pretty.
Stockcharts.com
1/20 -- In a rare occurrence, EVERY major index here (Dow, Naz, QQQQ, RUT and SPX) all stopped DEAD ON the upper lines of their new short term downtrends. That amount of unison is amazing (a little channel magic, maestro?). Unless Monday is a solidly positive opening, they will all likely back off and head lower again within those downtrends - perhaps even sharply.
Longer term, things are still quite positive , but definitely peaking or even rounding out a multi-month top in my estimation. By the way...I assume you all saw the new sector charts. Just remember, these are six-month charts -- not 20-day. I may add shorter ones if it seems warranted.
1/18 - Yup, small caps broke and took a dive. Short term trends are unquestionably down for them. That's taking the large caps down inside their channels as well. Fasten your seat belts...
Joe Reed is looking for a top in the S$P:
Mitchell Meana has an interesting chart for the Dow Jones Wilshire 5000 Index. He is looking for an upward target of 14,519 to complete the last leg of the rally before the next A-B-C correction takes hold:
He hadn't changed his earlier opinion on the Q's and is looking for the fiftth wave to take it up to $46.29. The Q's finished last week at support and can't fall much further without jeopardizing the count:
Ted Burge sees things in a more bullish light:
Jan 20th, 2007! THERE IS NOT ONE CHART ON THIS LIST THAT IS LOWER FRIDAY and on top of that there is not one stock in the Energy or Gold Index that is lower on Friday!
How do I know this? I looked at the prices on the reports we publish every night for the sectors.
On Thursday, contrary to popular opinion, there was not an 'O' added on the TRADITIONAL PnF CHARTS of the QQQQ, OEX,SPX,NYSE,TSE,XBD,JAPAN, EUROPE or MID Thursday.
QQQQ video told you before the open Thursday morning and it is a beauty! Resistance at 45.12 was strong resistance and the bleeding stopped at support. Have alook at the videos. they are a matter of record.
456 on the SOX has been published and unchanged as S/R since April 2003. Guess where IT closed today? (friday)
Friday morning before the open, we did a video on the OEX and if your bias is bearish, it 'ain't' on the chart.
There is also an updated video on the COMPQ as of friday Jan 19th at 11:00 AM and once again the facts are what we need to unnderstand.
The Nasdaq took a hit along with the SOX on Thursday and it is what happens at resistance along with the BP of the SOX dropping from 61% to 50%. The SOX is only 19 stocks and is a pitance when compared to the thousands of stocks trading on US markets.
www.tic-tac-dough.com It is where it is at.
I am told it is the most factual site on the web, but all I know is that there are facts you will get no where else.
Watch what happens at support and resistance. The rest will follow because price is the indicator we watch!
The portfolio has been closed because there was only one open position left. The profit swing between trading and buy and hold is huge on the trading side. I did another video explaing the mechanics of trading we used.
Learning is a journey and not a destination.
He highlighted the Nasdaq Composite Bullish Percent Index as an example of this strength:
Matthew Frailey is looking at a number of bullish triangles. One for the Dow Transports:
another in silver:
Robert New has continued with his negative divergences in all key indices:
But his semiconductor analysis is looking shady for the bulls:
So, in summary - if markets start to retreat off the open then Richard is likely to be on to something. If there is a push past Nov-Jan resistance, then Mitchell and Ted will be sitting pretty.
Stockcharts.com